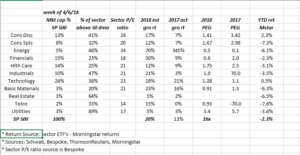
A reader asked about Sector P.Es a few weeks ago – haven’t updated the above spreadsheet in a few years:
- Financials – big jump in earnings growth rate, but i do think a lot of that is Berkshire’s gain. Berkshire is now the 5th largest holding in the SP 500 by market cap.
- Energy still shocks me – the growth rate has been through the roof the last two years and the sector has gone nowhere, no doubt due to Exxon’s and Chevron’s percentage of the sector.
- Technology should be fine in Q1 ’18, but a lot of the big cash repatriation should already be in the numbers.
Don’t ignore the sector as a percentage of the SP 500 market cap either: remember, Technology, Financials, Health Care and Consumer Discretionary (which is really being powered by Amazon and Netflix) is 67% of the entire SP 500’s market cap. Tech, Financials and Health Care is is 54%.
When earnings start, focusing on the companies that are executing – the big buyback programs DON’T seem to be driving stock prices unless revenue and execution are present.
Out this week with more on this.
Thanks for reading.