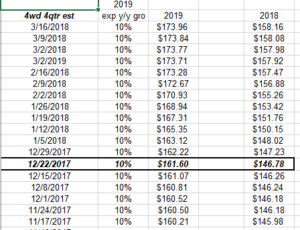
The goal of the above table is to give readers some idea of how the SP 500’s EPS estimates have changed the last few months.
The week of 12/22/2017 was the Friday the President signed the 2017 tax reform bill.
Here is another data table that might help readers:
- 2019: +10% expected SP 500 EPS growth
- 2018 +19% expected SP 500 EPS growth
- 2017 +12% expected SP 500 EPS growth
This blog was flagging the expected acceleration in 2017 SP 500 earnings growth back in May, 2016. Did that mean the SP 500 consensus analyst expectations were expecting a President Trump victory in 2016 ? The reason isn’t that important – the fact was following forward earnings estimates gave readers a powerful clue in May, 2016.
What is the latest data from Thomson Reuters this week ?
- Fwd 4-qtr est: $158.32 vs last week’s $158.23.
- P.E ratio: 17.4x
- PEG ratio: 0.38x
- SP 500 earnings yield: 5.75% vs last week’s 5.69%
- Year-over-year growth rate of fwd est: +20.8%, the 17th consecutive week of sequential increases in the y/y growth rate.
Conclusion: the SP 500 corrects on average 15% a year, but the fundamental SP 500 earnings trends are still positive, in fact, very positive.
Readers need to see the bigger picture on the index, for those who have the SP 500 in a 401(k), 403(b), or don’t want to pick stocks.
The sharp acceleration in expected 2018 EPS growth is unmistakable, and its powerful too.
Thanks for reading.