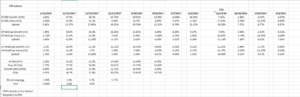
Every 6 weeks the goal is to give readers an update into the various “style box” strategies (large-cap, mid-cap, small-cap, value, growth, etc.) and year-to-date as of Friday, February 16th, 2018, 2018 has started just where 2017 left off in terms of large-cap growth outperforming the rest of the styles.
Horan Capital Advisors out of Cincinnati had a similar post on Twitter today.
Coming into 2018, clients saw their large-cap growth and Tech weighting reduced to benchmark weight (roughly 23% today) while the Financial sector weighting was increased.
Also, the small-cap value (IJS) ETF was added given small-cap and value’s continued under-performance.
Looking at the above spreadsheet, small-cap and value had a great year in 2016, relative to Tech and growth, thus playing “reversion-to-the-mean” around the various styles is another way to attempt to add value to client portfolios. 2017 saw the exact opposite of 2016.
When style-preference changes, it can do so in a hurry.
Even though the Nasdaq 100 and the Comp are still relatively cheap at 23(x) – 25(x) earnings, with low double-digit earnings growth, the expectation is that some rotation would occur away from large-cap growth if interest rates should rise smartly, and break the 3% high on the 10-year Treasury from late 2013.
It’s hard to quantify and I haven’t found any research on it, but certainly you would think that tax reform and cash repatriation benefited the large-cap sector greater than mid and small-cap simply given the cash held overseas by the likes of Apple, Cisco, etc. (Long both names)
Here is the update to the macro and sector allocation:
- It’s a secular bull market for US stocks and developed markets and emerging markets are starting to catch up too.
- Large-cap Tech and Growth was reduced in late 2017 and early 2018, and Financial’s were added to client accounts.
- Some small-cap value exposure was added too via the IJS.
- Tech, Financial and Health Care still comprise 53% or thereabouts of the SP 500 market cap – owning those three sectors gets you the majority of the SP 500 market cap
- Client bond portfolios were positioned in cash, money market, T-Bills, JP Morgan and BlackRock mutual funds, and a 5% – 10% position in the TBF, which looks very good today, but to be frank with readers, client bond accounts have been positioned that way for years. Rising interest rates were expected well before 2018, and portfolios paid the price in terms of bond allocation, total-return under-performance. But that is quickly reversing.
- Emerging Markets just broke their 10-year downtrend in early 2016, so that bull market is far earlier than the US. Clients have a 3% to 6% weighting in EM ETF’s in their accounts, with the expectation that that weighting will increase. I’d like to see a stronger dollar, if only for little while to cheapen up the non-US asset class.
The bigger picture – thanks for reading.