Two items read this week, were a little worrisome:
1.) Liz Ann Sonders, Schwab’s great strategist, posted this to Twitter on Thursday:
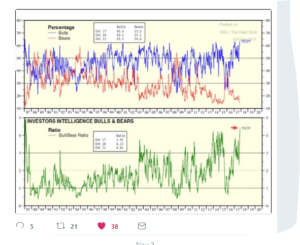
During most of this secular bull market, sentiment has been a mixed bag with the AAII data being perennially bearish to the point where some wonder whether it is even worth measuring the data, while the “newletter” writer crowd and more institutionally-minded have been pretty bullish.
2.)
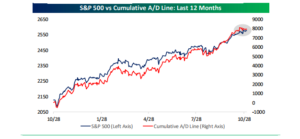
Bespoke’s “stale breadth” post on the evening of November 2nd, was somewhat surprising given that “good breadth” has been a hallmark of this rally all year.
3.) While ready to post this column, Horan Capital posted a piece by SeeitMarket, accompanied by a graph of breadth and momemntum:
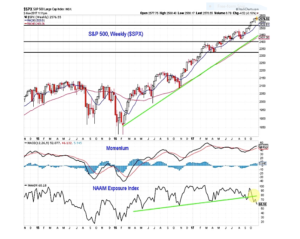
Consistent with the weakening breadth argument this past week was that while the Nasdaq Composite and the QQQ’s were up over 1% on the week, the Russell 2000 as measured by the IWM was down 80 bp’s on the week.
If small-cap’s weaken or even stay flat and large-cap Tech or the Big 10 of the SP 500 continue their year-end rally, breadth will continue to flag, and the indices will continue to move higher.
Where Might Value be in Today’s SP 500 ?
1.) Technology and Financial’s were the bull-market leaders of the 1980’s and 1990’s, and the two sectors that led to 50% corrections in the 2000’s. Obviously there are the secular growth stocks of this bull market that are Facebook, Netflix, and what I call the “tweeners” Tech stocks that spanned a little of both decades like Amazon and Google, but look at some of what i refer to as the “original gangsters” or the 1990’s growth stocks that are working off 17 year bases and could be poised for all-time-highs. (Microsoft hit a new all-time-high in late 2016, and hasn’t looked back. It has been client’s largest position with a couple of exceptions for the last 5 years), Oracle is another ’90’s growth leader trying to firmly breakout to all-time-highs and readers still have time to get in on what I think will be much higher prices Intel and Cisco are two hardware giants trying to gain some traction. Intel looks technically better than Cisco though. (Here was the October, 2015, Seeking Alpha article where the “original gansters” term was coined.) Long all stocks mentioned.
2.) Numerous Financial stocks are not too far from all-time highs:
- Schwab (SCHW): $45 to $51 is the 1999, 2000 highs for Schwab and when the stock breaks out of this consolidation, technicians will tell you the stock could run for a while
- Goldman (GS): the investment-banking giant needs to trade over $250 per share to break above the 2007 and the early 2017 high. I worry that Goldman is the “last bull market’s” leadership stock but the stock will continue to generate earnings and revenue growth consistent with the post Dodd-Frank world.
- JP Morgan: JPM broke out to all all-time-high in 2016, sank back after the China devaluation and then broke out above in 2016 and hasn’t looked back.
- Chicago Merc (CME): its 2007 high was $142 and change and it is almost there. However readers can also own ICE or the CBOE too. CBOE is tied to VIX and option trading volume. CME’s biggest futures contract by volume is the Treasury pit so a meltup in Treasury yields is a CME catalyst.
- Also owned are the XLF, the KRE, KBE and the IYF.
3.) Biotech is roughly 20% of the Health Care sector and the Health Care sector is roughly 15% of the SP 500 by market cap:
IBB: large cap biotech ETF hit a high of $400 in late July ’15 and has been building a nice base since then. Biotech seems to outperform when small-cap’s outperform so if the IBB worries you, own a little XBI. The XBI hit a high of $91 and change in mid-2015 and is also working off the correction. It looks closer to the breakout than IBB.
4.) Don’t forget Emerging Markets: The EEM and VWO are the two longer-serving Emerging Market ETF’s that are STILL more than 10% below their 2007 highs. Recently the IEMG was bought for clients too. The weaker dollar no doubt helped the emerging market asset class this year, and so I’m waiting for a bought of dollar strength and the next global correction to add to the asset class.
Again the EM’s are still below their 2007 highs.
The struggle is what’s the appropriate weight for EM’s in client accounts: Van Eck recently did a conference call and noted that EM economies are about 15% of global GDP, so a neutral to slightly overweight position relative to the global GDP market cap would seem prudent. Current weighting – depending on the account – is between 3% – 10%.
Conclusion: Other “gangsters” that look poised for a longer-term breakout are names like Coca-Cola and WalMart, which needs to trade over the early, 2015 high of $90 to breakout to all-time-highs once again. I just dont know if WalMart can continue to push that rock up the hill known as Amazon. Walmart spotted Amazon a 20-year headstart before getting serious about ecommerce. Remember, price tells you everything.
The risk advantage is that by buying long-term laggards on the verge of longer-term breakouts, there is less “hot money” in these stocks and more strong hands. And technicians will tell you, longer-term resistance for these stocks, once broken should act as support, which could aid in risk management in a drawdown.
Clients are long all these stocks and ETF’s mentioned.
The 2018 strategy will updated with forecasts sometime mid-to-late December ’18.
What is written here for readers is simply what we have done and are doing for clients. (Opinions and positions can change at any time, without an update being provided).
Another blog post was prepared for today, but the above charts and graphs caught my eye, in terms of indicators flashing yellow.
Thanks for reading…