The forward 4-quarter estimate this week jumped to $142.25, up from last week’s $141.90, and what’s unusual about that is that – as we progress through a quarter – the trend is typically downward. (You’ve heard this here before.)
So what’s happening with SP 500 earnings ? Well, analysts are getting more confident and increasing forward quarter estimates, versus “starting high and going low”.
Here is what the forward earnings curve looks like ?
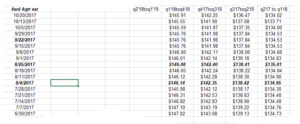
Pardon the small type: I’m a technological Luddite and still trying to work with Office 10 tools.
The 2nd column on the spreadsheet is the “forward 4-quarter estimate” as we started this quarter: that would be the sum of the bottom-up estimates from Q4 ’17 to Q3 ’18.
Note the first column though: that is the “forward 4-quarter estimate” as we roll into 2018, so it represents the 1-quarter forward, 4-quarter estimate.
The stumbling block, and ive asked Thomson to publish the data is that they are not publishing the bottom up estimates for each quarter for 2019.
But for the two “forward estimates”, as you scroll up the spreadsheet from 91/1/7 note, how little deterioration there is as time passes up to October 20, ’17.
Navel gazing ? Probably. Could too much be read into this data, this early ? Sure. Economic conditions can always change.
Here was a post from May ’16, noting the same pattern for 2017, which was validated this year.
The fact is the US economy has been relatively stable, and it’s easier to make forecasts.
Thomson Reuters data (by the numbers from This Week in Earnings, 10/20/17)
- Fwd 4-qtr estimate: $142.24
- P.E ratio: 18.1(x)
- PEG ratio: 1.79(x)
- SP 500 earnings yield: 5.52%
- Year-over-year growth of fwd estimate: +10.13% versus last week’s +9.8%.
This is the second time this month, the growth rate of the forward estimate (last bullet) has moved over 10% – that growth rate finally looks to be turning higher and moving over 10% a longer duration.
This metric has not been over 10% for any length of time, post-2008.
Financials have caught a bid since our September ’17 post here.
Technology, Financials, and Health Care are still 53% of the SP 500 by market cap. No changes are planned until year-end ’17 or early ’18.
Thanks for reading…