Everyone and their brother is commenting on q2 ’17 SP 500 earnings results, and the numbers so far look good. Revenue “upside surprise” (i.e. the revenue “beat rate”) is north of 60%, probably aided somewhat by the very weak dollar this year, down 6.5% – 7% year-to-date. What is puzzling is that – during the record strengthening of the dollar from October ’14 to March ’15 and the quarters that followed, when companies that reported would constantly say “well without the strong dollar, our revenue growth would have been x” – today, we don’t hear that “qualifying” language from corporate managements. However, to be fair, so many SP 500 companies now report their revenue growth in constant currency as a matter of routine somewhere on the call, that analysts now make the adjustments routinely.
The fact is Q2 ’17 SP 500 earnings growth is pretty healthy at +10.8%. (Here is what this blog said about the 2nd quarter ’17 on June 9th ’17.)
But how do the forward 2 quarters for the rest of ’17 look ?
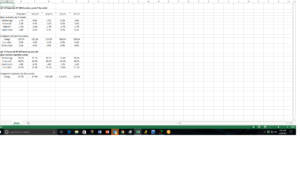
So what is the spreadsheet telling investors ?
For Q3 ’17 estimated SP 500 earnings growth, Health Care, Telecom and Utilities have seen their growth rates revised higher since July 1 ’17. Health Care surprised me a little – that is worth paying attention to given its 15% market cap weight in the SP 500.
The sector with the sharpest declines for Q3 and Q4 ’17 is Energy, now a 6% – 7% market cap weighting in the SP 500, down from 14% – 15% in October ’14. Crude oil has had a very nice run of late. Let’s see if the estimated growth rate of the Energy sector changes in the next few weeks or if the estimate revisions continue to trend lower.
Q4 ’17 estimated SP 500 earnings growth – this was the real surprise.
4 of the 11 sectors of the SP 500 are reflecting higher expected earnings growth for Q4 ’17 today, than on July 1 ’17.
Those 4 sectors are Consumer Discretionary, Consumer Staples, Health Care, and Industrials. (Consumer Discretionary is dominated by Amazon today, so expect a strong holiday quarter for the e-commerce giant, but the remaining sectors could be reflecting a continued weaker dollar. Staples in particular with its low organic growth rates, benefits from a weaker dollar. Philip Morris (MO) took it on the chin Friday, down sharply.
Again, to be clear to readers, what’s readers should take away is NOT the absolute level of earnings growth (although it’s not to be ignored) BUT the revisions, and the degree of the revisions for a forward quarter.
Usually at this point in time, revisions for forward quarters are typically negative, usually to the degree of 2% per month.
The fact that Technology and Financial sector estimates for Q4 ’17 are stable, and four of the other 11 sectors are positive, is reflective of an analyst community that is looking for faster growth as we head into the Q4 ’17 and even the back half of 2017.
Analysis / conclusion: As anyone who has worked with a data set for any length of time, you can usually torture the numbers to get any desired result. These Thomson Reuters sector growth estimates have been telling a good story for some time, although I failed to highlight the Health Care sector until just this week.
The added plus for me as an investor is that sentiment remaining almost universally negative for the stock market as we head into the weak seasonal period of August – September.
Readers can play it any way you like, and we could see a seasonal correction the next few months, but expect a typical, Q4 ’17 rally and given how the numbers are falling out, it could be stronger than you think.
Are analysts factoring in a tax cut or a reduction in cap gains tax rates ? Could be, given the mess of the last week with Health Care, it really is hard to believe Congress can pass anything, although I suspect tax cuts are easier than Health Care.
Clients remain overweight Technology, Financials, and Health Care via biotech, is being lifted as a percentage of client accounts gradually. With these three sectors, readers / investors capture 50% – 55% of the market cap of the SP 500.
Apple is the big dog today in the SP 500 and the QQQ’s at 3.68% and 11.5% of the market cap of each benchmark respectively. Apple reports Tuesday, August 1. Sentiment is expecting a weaker, less robust quarter in anticipation of the Apple iPhone 8 launch in September. (Long Apple for clients, but the weighting has been gradually coming down over the years.)
For those that can play a longer game, stay overweight the SP 500 and the Nasdaq in balanced portfolios. The fixed-income markets offer little longer-term value in my opinion.
(Warning: these are simply opinions, opinions gleaned from watching SP 500 sector earnings data for many years. Take all opinions with a grain of salt, and while I try to give readers a good idea of how money is being invested for clients, portfolio’s can differ based on many different factors. )
Thomson Reuters data by the numbers: (Source “This Week in Earnings”)
Fwd 4-qtr estimate: $138.17
P.E ratio: 18(x)
PEG ratio: 1.9(x)
SP 500 earnings yield: 5.59%
Year-over-year growth of the forward estimate: +9.2% – still hasn’t pierced the magical 10% level.
Thanks for reading.