B.I.G._Tips_-_Nasdaq_100_Epic_Streak (1)
With so much investment-related information data, available daily on a plethora of blogs, Twitter, not to mention the mainstream financial media, every week there is just an enormous amount of market-related data to sift through.
The above chart and detail from Bespoke notes that a trade of the Nasdaq 100 historically has meant poor forward returns through the next three months.
Here are the top 5 components of the QQQ and their respective market-cap weights in the key ETF:
- Apple: 11.5%
- Microsoft: +8%
- Amazon: 7%
- Facebook: 5.5%
- Google (C): 5%
The top 5 stocks in the Q comprise 36% – 37% of the QQQ market cap, according to Morningstar data.
Here is the daily QQQ chart from internal technical software, which shows a little more downside left for the Q’s to drop, before investors need to get nervous. However, note the red bar (indicates heavy volume on downside price action) which readers would like to see subside over the next week.
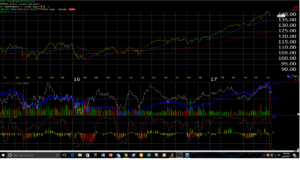
Watch the 50-day moving average for the Nasdaq 100.
The QQQE is an equal-weighted ETF that is still owned for clients, and eliminates that market cap concentration.
An earnings update will be out later tonight or Saturday morning.
Thanks for reading.