In 2016, Technology didn’t do very well with the Nasdaq up 6% – 7% when looking at the full-year returns of the Nasdaq Comp and the Nasdaq 100, as the SP 500 rose 11.9% last year and the Russell rose over 21%.
Technology remains our largest overweight.
We never owned Emerging Markets for clients until Q1 ’16, when the 10-year return on the VWO (Vanguard Emerging Market ETF) and the EEM (iShares Emerging Markets ETF) both turned negative. Josh Brown over at the Reformed Broker started writing about the outflows from the Emerging Markets space in late 2015, which was a reaction to the China devaluation meltdown in late July – early August ’15. That started getting us interested in the space. (Pimco also made a prescient call on EM’s in the Spring of ’16 too – it was written about here.)
Part of the lack of appeal of the asset class is that these countries are commodity-based economies, with a lot of debt and heavily tied to Energy too, and well, none of those asset-classes did well in the disinflation that followed 2008.
Brazil was truly unique since not only did it have ties to Energy via PBR (Petrobras) and the grain markets via soybean exports, etc. (look at how Caterpillar and Deere performed post 2008) but you had the corruption trial of Dilma Rousseff occurring just as Energy and commodity prices were melting down in late 2015, early 2016.
The EWZ was too good to pass up and we took a position in it for clients in early, 2016, to the tune of 1% – 2% of client accounts.
Brazil and the EWZ was the poster-child for commodity price pressure, weak currency a corrupt socialist government, and much more.
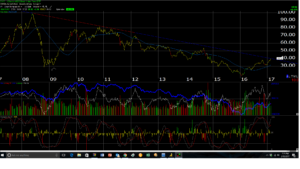
The above chart looks like EWZ is on the verge of breaking out if its 8-9 year downtrend off the 2007 highs near $102 in May, 2008. EWZ turned up as Rousseff left office, and a more free-market, business-oriented government took over.
One of the few things I did right pre-2008, besides not owning any housing or residential real estate directly for clients, was that clients were kept out of the very hot commodity and Emerging Market and China plays that attracted so much money from 2000 – 2008. The EWZ fell $70 or roughly 70% in value from May ’08 through October ’08.
While the above chart shows $40 could be tough resistance, watch how that key price level plays out.
The VWO, EEM and the EWZ all look like they are trying to move out of long-term downtrends. The lowest client cost basis on the EWZ is roughly $20, with the majority bought around $27 – $28.
Total exposure to the asset class is probably between 3% – 5% of client accounts, depending on the client.
A “return-to-global-growth” theme and a return to faster GDP growth around the globe, and some reflation, I think bodes very well for this asset class.
Emerging Markets at least in the near term will likely be more closely correlated to the SP 500 too.
Thanks for reading…