Exxon (XOM) and Chevron (CVX) are the two big giants in the Energy sector. Both companies combine for a whopping 33% weighting within the XLE (SPDR Energy ETF) and 28% weighting within the IYE (iShares Energy ETF).
Of the two stocks, Exxon has always been preferred for client accounts, given that the company has remained free-cash-flow positive throughout what has been a brutal downturn in the price of crude oil and natural gas, while Chevron has not.
Exxon however did not report a particularly good 2nd quarter, 2016, missing both EPS and revenue estimates by a mile: Exxon reported actual EPS of $0.41 vs a $0.64 consensus while revenue missed by a whopping 10%, printing $57.6 billion versus the consensus Street estimate of $64 billion even.
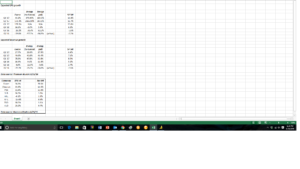
According to Greg Harrison at Thomson Reuters, because of the collapse in Energy earnings, Exxon and Chevron today constitute 86% and 33% of the earnings weight of the sector, while revenue weights represent 28% and 14% respectively, with the point being that Exxon and Chevron are accounting for all of the net income for the Energy sector and almost half – 42% – of the sector’s revenue. (See the table set in bold at the bottom of the spreadsheet.)
Of the 37 Energy companies in the SP 500 today, roughly half are not currently profitable (i.e. negative earnings weight in the index.)
Bespoke noted in their weekly Bespoke Report tonight, that while crude oil is up roughly 12% in August ’16, the sector is up just 3% on the month.
While I never expect to see $100 crude oil again in my lifetime, I do think crude can push toward $60 and maybe $70, recovering half its peak price near $140 – $145 from 2007.
Conclusion: The point of the article was to see if Exxon was having a substantial negative impact on the expected EPS and revenue growth of the Energy sector since its Q2 ’16 earnings report, and in fact, Exxon is not a drag on the sector’s expected growth, and is still contributing positively to the sector. Looking at the above sector and Exxon’s expected growth rates versus ‘”Energy, Ex-Exxon” the oil giant is still showing better expected growth than the rest of the sector, until Q3 ’17.
But here is the caveat for readers: these are still forecasts, and although they are based on the expectations of the sector experts, these consensus estimates are just that – estimates. They change daily and they will change again in late October, early November, when Exxon and Chevron report Q3 ’16 results.
Revenue growth has started to improve for the sector, but EPS growth is lagging revenue growth.
Remaining a nervous Energy bull, Q3 ’16 should start to show better results across the broad sector, and really I’m focused on Q4 ’16 through Q1 ’17 in terms of results and forward revisions. In the first quarter of 2016, basically all the profits of the energy sector were wiped out, (just like the Financial’s in Q3 ’07), so even if a reader is skeptical of the long-run prospects of fossil fuels and crude oil and gasoline prospects, the sector should outperform – in my opinion – for at least the next 6 – 9 months,
A crude oil (WTI) trade through $50 – $51 decisively would only help the sector.
Exxon-Mobil is oversold on the daily chart, and likely due for a nice bounce.
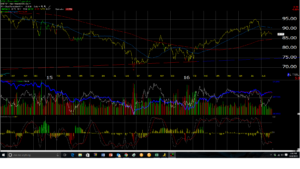
Some thoughtful readers have a real issue with the long-term viability of the fossil fuels. A trade in XOM back through $95 to the upside would be a welcome occasion for the Energy bulls.
(Remember, estimates and forecasts can change at any time. Positions can change at any time. Long a small position on XOM, mostly long IYE, XLE, OIH for clients. May add to XOM for a trade.)