Most investors can talk valuation until they are blue-in-the face, but I’ve learned to ignore the charts at significant peril.
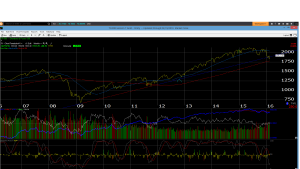
The above link is the weekly chart of the SP 500, and as readers can see, the SP 500 remains above its weekly trend line off the March, 2009 low.
A lot of technicians are watching 1,950 as a key technical level over which the SP 500 must trade to begin to repair the technical damage suffered over the last 8 – 9 months.
Bearishness is at long-term extremes. The political rhetoric is anything but “free-market”. Mark Cuban has coined a new term called “Socio-Capitalism” which implies a Bernie Sanders-like social consciousness, combined with entrepreneurship and capitalism, as is discussed in this article. It might explain the ascension of Sanders and the seeming “anger-vote” driven by Trump.
Aside from sentiment and the election, here is what I think could go right for the stock market over the next 6 – 9 months:
1.) Inflation: sounds like the proverbial pipe-dream, but the core CPI data is starting to increase, and it isn’t just starting to increase, but to increase at an increasing rate. Still it is doubtful that the US consumer is headed for the kind of mild hyper-inflation we saw in the late 1970’s. Services are 80% of GDP, and the services CPI is nearing 3%. It is a drum I’ve beaten before for readers, but check out Bespoke’s research and in particular the Bespoke Weekly letter that Paul Hickey authors every week. Walmart is America’s largest employer and they are scheduled to institute phase II of their wage hike for hourly employees. It will be interesting to see how and where this shows up in inflation and average hourly earnings data (think monthly nonfarm payroll report).
2.) GDP growth: Barron’s noted this weekend that the US economy could be looking at 3% GDP growth in Q1 ’16. Retail sales were strong for January ’16. Growth is good – better earnings growth isn’t showing up in earnings yet, though.
3.) Weaker dollar: the dollar index continues to back off it’s 100 level that it traded around from late March ’15 through early January ’16. A drop through 95 might indicate another leg lower. The important thing though is that the dollar index not strengthen from here and break through 100. My own opinion is that a continued gradual decline in the dollar index gives Janet Yellen some room to push rates higher since a stronger dollar is a “de facto” tightening.
4.) Crude oil prices: a stabilization around $30 wouldn’t do much for the cash-flow strained small and mid-cap energy companies, but at least a stabilization in crude might have a positive psychological affect on investors.
5.) The hardest hit sectors in 2015 – Energy, Basic Materials, the Russell 2000, biotech, and Emerging Markets – start to stabilize. Given the tech and financial bear markets of the 2000’s those two sectors seemed safe for overweighting, but both sectors have been hit hard in 2016.
6.) Value is starting to outperform growth, still not the 900 basis point out-performance that Growth held versus Value in 2015, but it is a start.
One source thinks the three most over-crowded trades are:
1.) Long US-dollar
2.) Short Energy
3.) Short Emerging Markets
Breaking these over-crowded trades might go a long way to breaking the psychology of this market. (Long XLE, IYE, CWO, EEM in small quantities.)
1,950 is the battleground for bulls and bears.