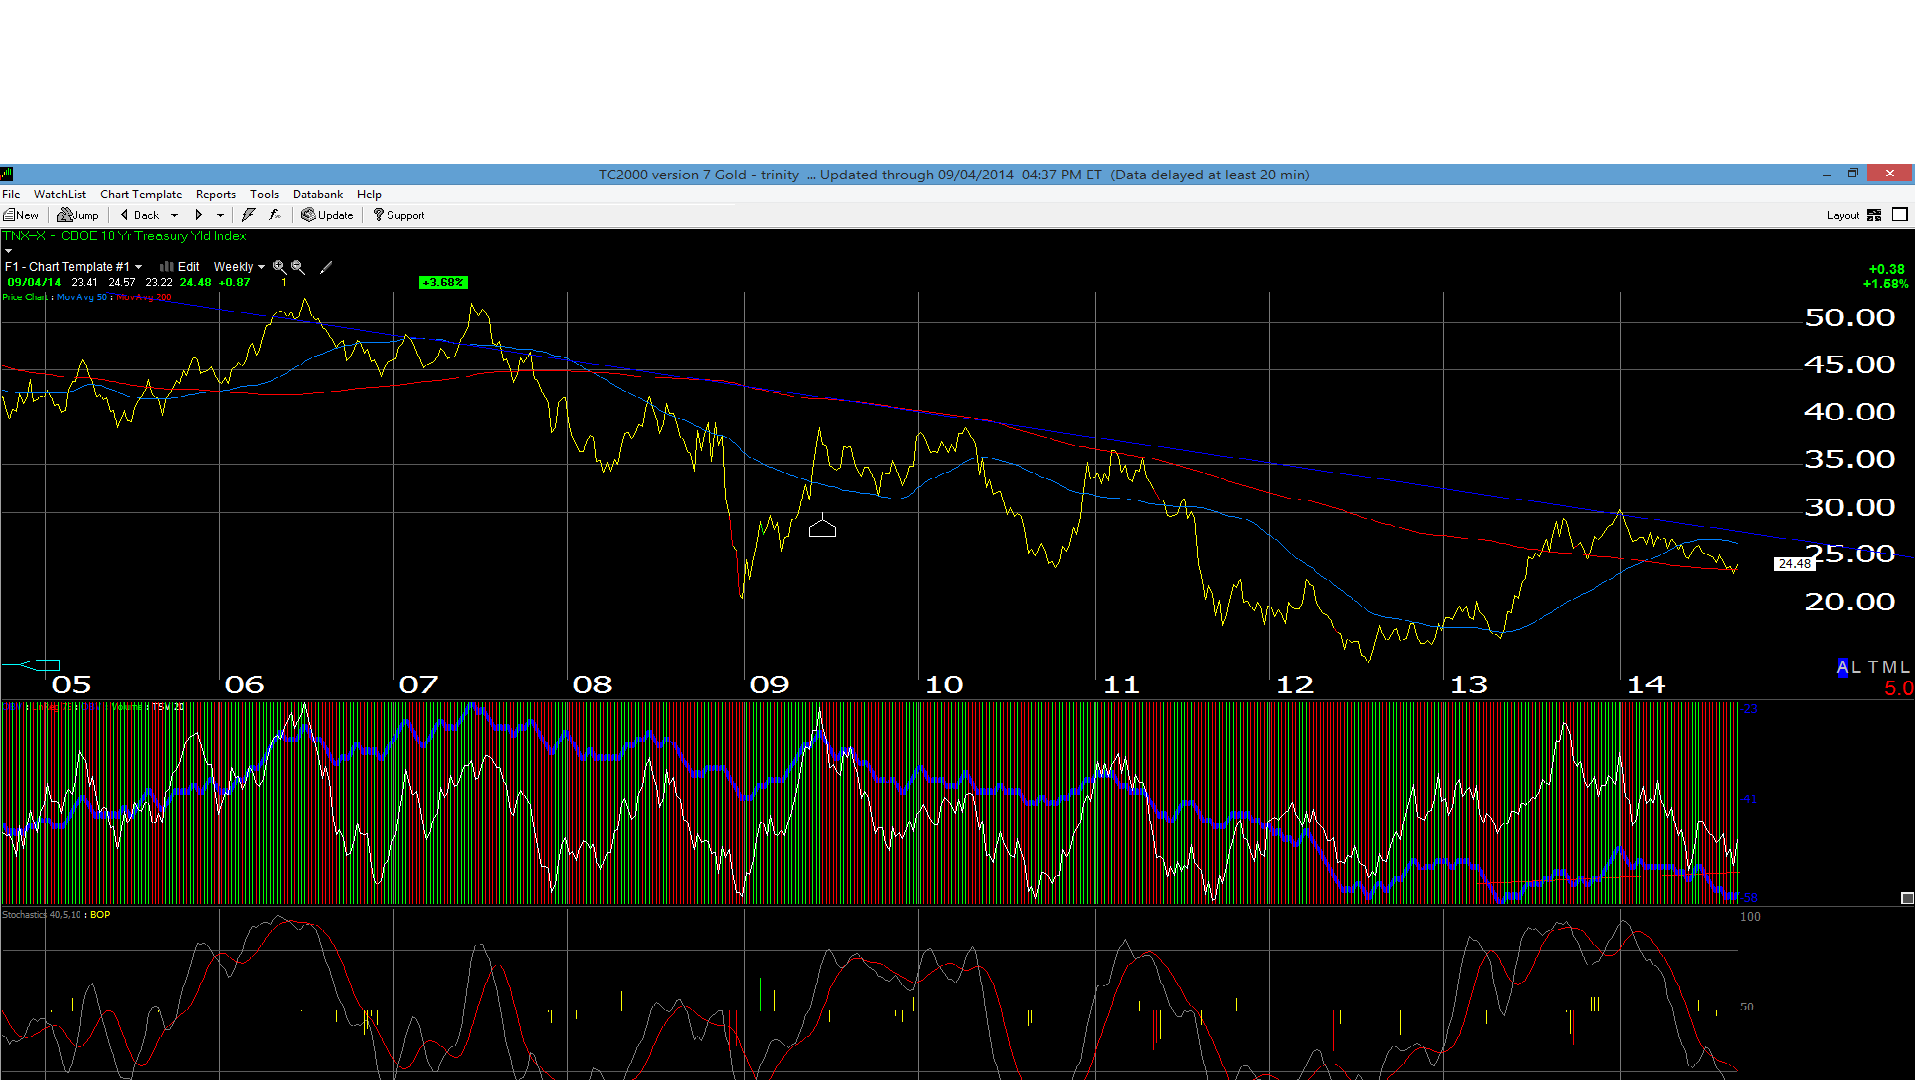
Hopefully readers can see the weekly chart of the 10-year Treasury Yield, from the TNX or the CBOE 10-Year Treasury Yield Index contract.
It looks like a perfect “hold” or save in terms of the 10-year Treasury Yield 200-week moving average, which is the red line that contract bounced off both on August 15th, with a trade down to 2.30% and then August 28th, when the 10-year yield dipped again to 2.32%.
Even David Tapper came out today and noted that the bond rally was ending, as this news piece from Seeking Alpha details.
We are still long a position in the TBF or the unlevered Inverse Treasury ETF, but have reduced the position. If you look at the above chart, the TNX is was oversold on a weekly basis, which is where we like to be a buyer. (The TBF position really detracted from balanced account performance in 2014, and I’m not happy about it. )
In terms of fundamental catalysts, tomorrow morning’s August nonfarm payroll number suddenly has everyone’s attention. Most economist’s seem to be between 220,000 and 250,000 new jobs created by the US economy in 2014.
The 10-year Treasury yield has failed to make a new low for 3 weeks now. Could the turn be at hand ? Rick Santelli keeps pointing out the importance of the 2.45% yield level for the 10-year, while Karl Snyder, CMT, also highlights the 2.45% – 2.46% level in the 10-year yield.
The point is we are right “there”: we are at an important point in the cycle. The 10-year and 30-year Treasury have rallied almost 9 months now, in a huge curve-flattening trade, that had us positioning client rates this year.
A number over 300,000 tomorrow and I would suspect Treasuries will take it hard. The tone I am hearing from various Fed Governor comments, is growing increasingly hawkish, even as Fed Chair Yellen remains balanced.
A number under 200,000 and we could re-test 2.30% again.
Actually a more important tell would be a weak number, and a decline in Treasury prices. We’ve had 6 months of Treasury’s rallying on stronger data.
The 10-year Treasury Yield chart) TNX hasn’t been this oversold since late 2012.
Thanks for reading. We’ll know more at 7:30 am central time, Friday, 9/5/14.
Trinity Asset Management, Inc. by:
Brian Gilmartin, CFA
Portfolio manager