We will be out with our Weekend Earnings Update tomorrow, Saturday, 10/5/13, but we wanted to put up a quick chart of HPQ.
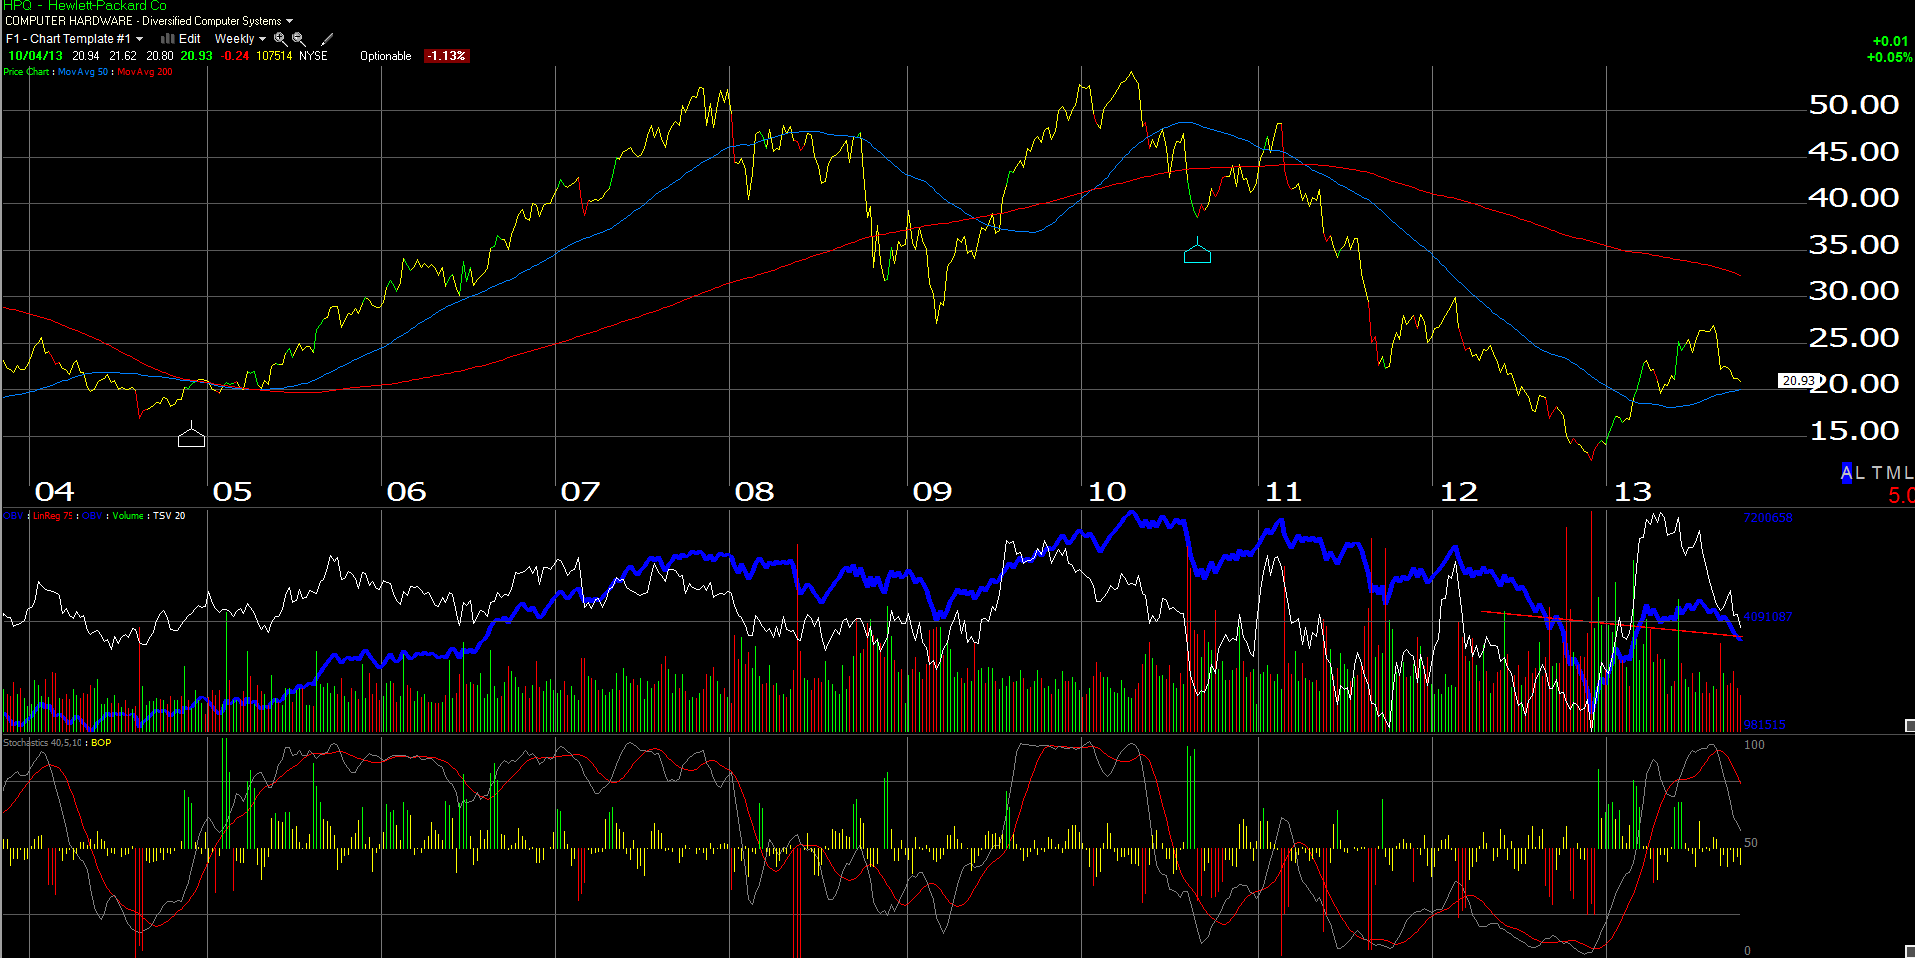
We’ve been picking away at the stock with a trade under $22, as the stock is getting very oversold on the daily chart, but it is the weekly chart that is the real technical test in our opinion.
$20 is a key price level, and we think it will hold, therefore we are prepared to add to current positions and lower our cost basis when as the stock drops into the $20 area.
$20 is the point of the 50-week moving average, which has now started to flatten and turn slightly higher.
HPQ’s fundamentals paint an interesting story too: the fiscal ’13 and fiscal ’14 EPS estimates have stabilized, and the stock is very attractive on a cash-flow basis. The first column is the month ended, the 2nd column is the fiscal ’13 EPS estimate, and the 2nd column is the fiscal ’14 EPS estimate (EPS source of data is ThomsonReuters EPS consensus estimates):
10/4/13: $3.55 and $3.63
9/30/13: $3.55 and $3.64
6/30/13: $3.57 and $3.66
3/31/13: $3.51 and $3.58
12/31/12: $3.31 and $3.48
10/31/12: $3.51 and $3.89
After fiscal ’14 estimates saw a sharp downward revision, the consensus EPS estimate has started to grow again, as has 2013.
More importantly, with the last quarter’s report, HPQ is trading at 4(x) cash-flow and 5(x) free-cash-flow.
HPQ is pretty cash-rich, with $13 billion in cash on the balance sheet, with $17 bl in debt, down from $25 bl of debt 6 quarters ago.
If we exclude just the current asset cash and equivalents, and ignore “long-term investment cash”, here is the trend in “price to cash-flow” (ex cash), and “price to free-cash-flow” (ex cash) for the last 5 quarters:
7/31/13: 3.1(x) and 4.2(x)
4/30/13: 2.3(x) and 3.0(x)
1/31/13: 1.6(x) and 2.3(x)
10/31/13: 1.4(x) and 2.2(x)
7/31/12: 2.9(x) and 5.5(x)
We will add more HPQ around $20. A trade below $19 on volume would be our stop-loss and the exit trigger.
No question, Meg Whitman has a tough job, but HPQ has more options to generate growth than a monoline PC company in my opinion.
The sector is out of favor for sure, but the Enterprise Server segment, at 25% of HPQ’s revenues, has seen segment operating income increase from 25% to over 40% of total operating income.
Not all is lost.
Morningstar has HPQ’s intrinsic value at $24, while Trinity’s internal model values HPQ closer to $30. Split the difference and the reader gets to $27 or a 30% return minimum from the $20 – $21 area.
Be patient, I think this will work for our clients.
Trinity Asset Management, Inc. by:
Brian Gilmartin, CFA
Portfolio manager