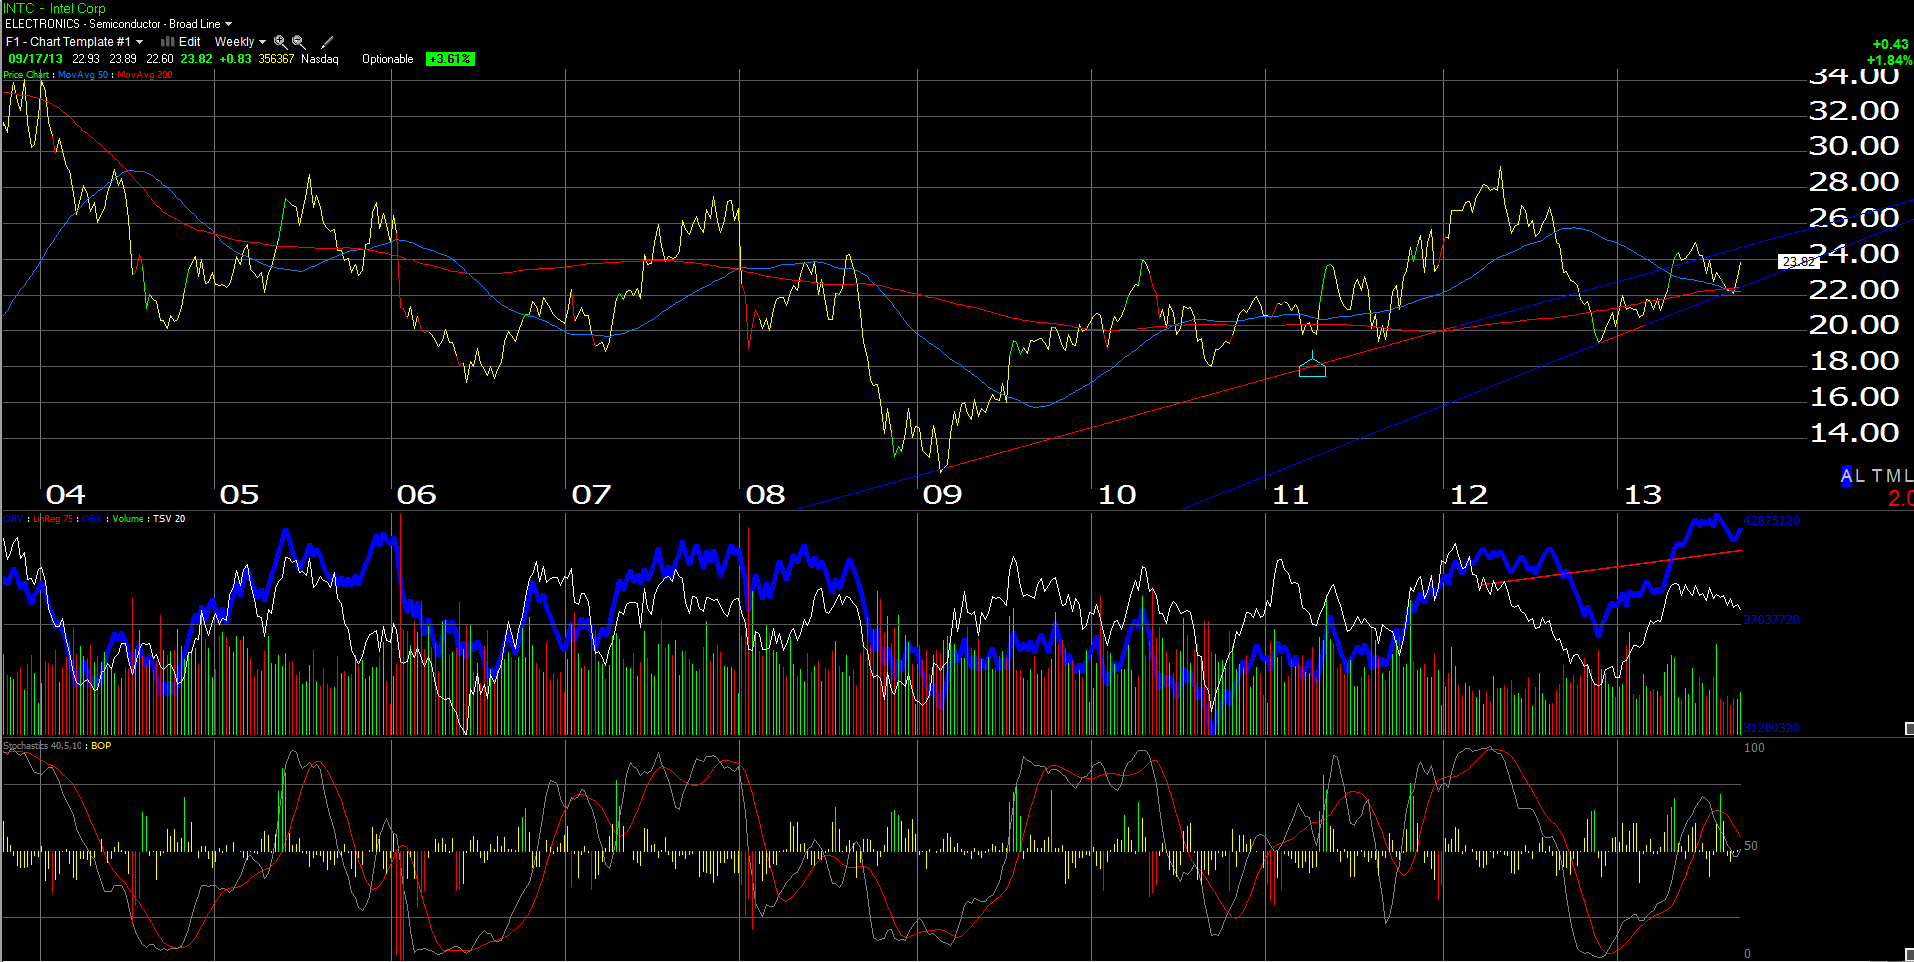
We will lead off with the 2nd chart first which is Intel (INTC), perfectly coiled to move higher off its converging 50 and 200 week moving averages as well as the trendline uptrend on the monthly chart.
A trade above $25.50 for INTC on volume would put the stock above the 200-month moving average on the monthly chart, a level which the stock traded above briefly in 2012, and then again in 2008.
Most importantly, INTC is still trading at 5(x) cash-flow and looks very solid from a valuation perspective, but the truth to that is, we’ve been writing this for a while (i.e. INTC’s attraction from a valuation perspective).
It’s really not about PC growth any more, but how fast INTC can transition to mobile to grab a chunk of that market, and basically hope for any mid-single-digit bounce in PC unit growth to add to the secular growth of mobile.
With a 3.80% dividend yield, INTC is paying investors to wait. 2012 and expected 2013 EPS growth was -11% and a 12% decline, and then the Street is looking for 5% and 3% for 2014 and 2015.
Technically, the stock is set up nicely, but INTC needs some positive fundamental news to push it into the high $20’s, low $30’s.
————
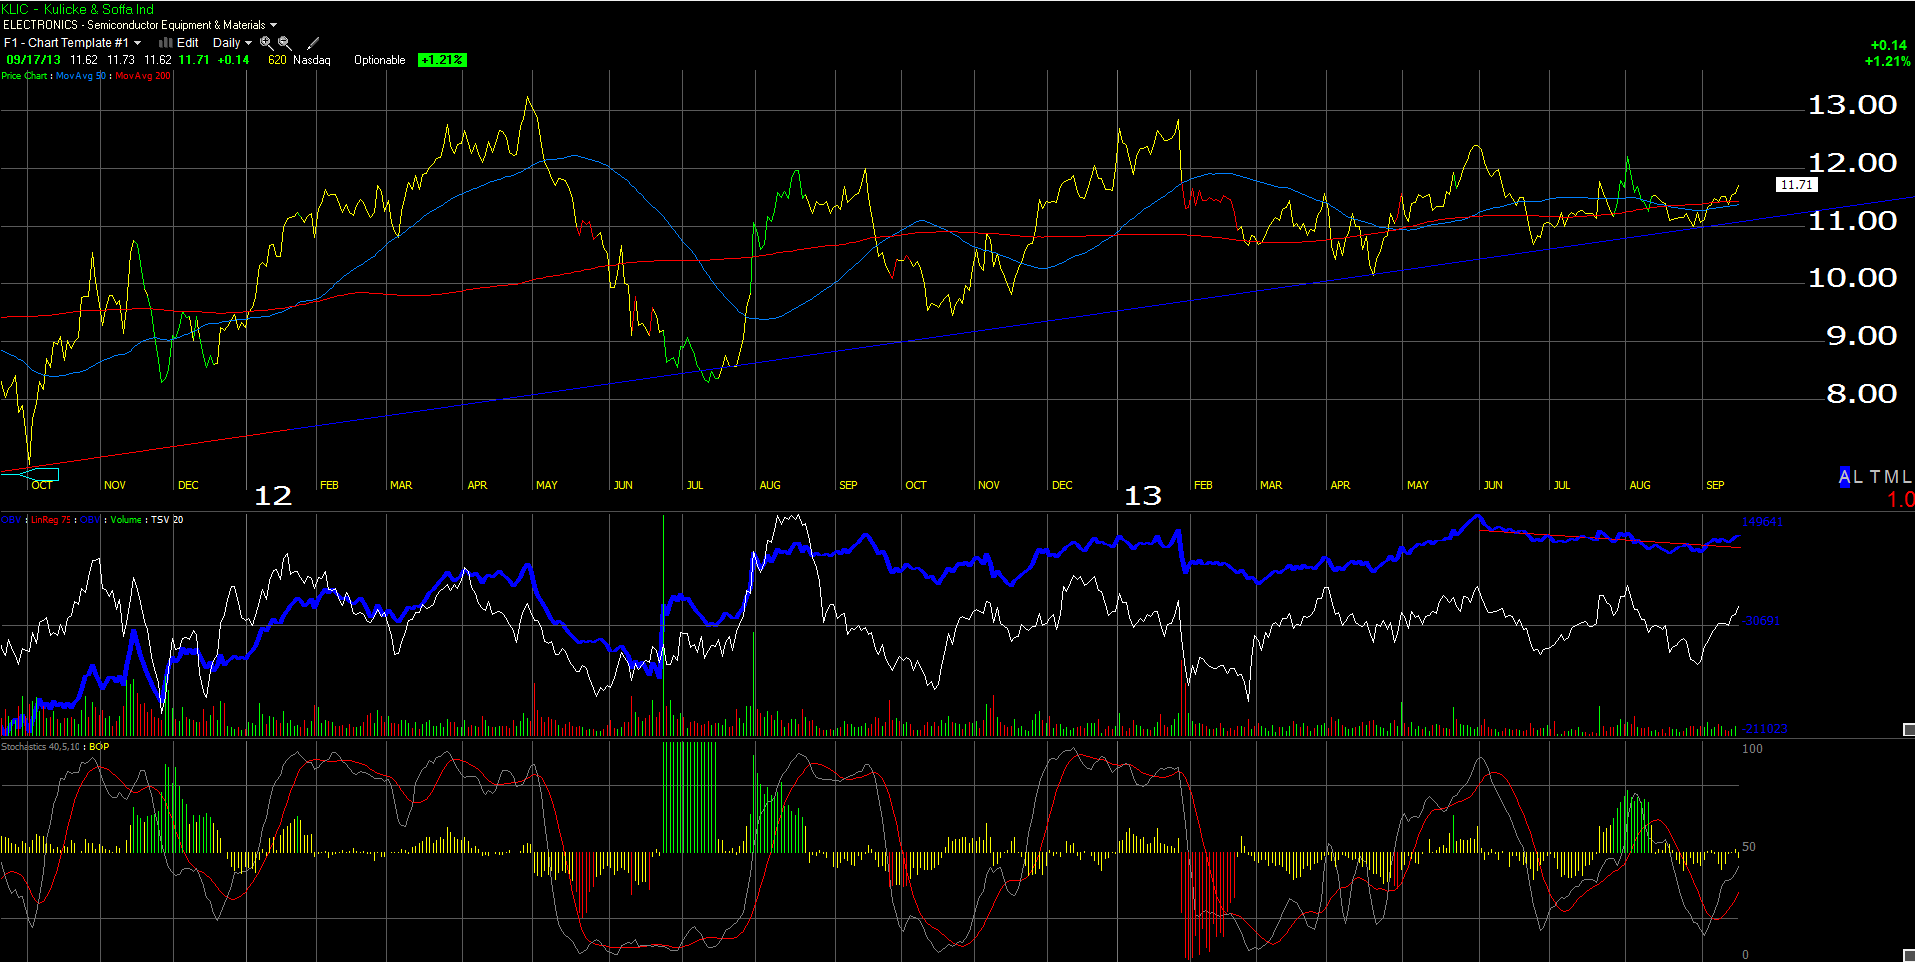
The first chart is the daily chart of KLIC, a wafer and bonder semiconductor capital equipment company. The action in a number of semi stocks incluidng INTC, SNDK, and MU is interesting, but we wanted a smaller-cap name to add to the group.
Fundamentally, there is little exciting happening. An examination of consensus 2013 earnings and revenue estimates for KLIC notes that analysts are expecting a drop of 31% in revenues and 62% in EPS, after KLIC printed $2.13 and $791 million in revenues last year.
We do like KLIC’s free-cash-flow generation, since capex is minimal. However there is no dividend or share repurchase plan yet, that we can see. (Financial’s source: ThomsonReuters data).
Maybe that is the case: expectations are too negative, and the sector is acting better. We’ve owned KLIC in prior years and the stock tends to be an early-warning canary for the sector.
Technically, Gary Morrow, a technician we follow, likes the set-up. His comments are found below:
———————–
Kulicke & Soffa
Kulicke & Soffa is setting up well for an upside breakout. The stock remains in the middle of its 2013 range but it is becoming more apparent that an important bottom is in place. KLIC has been moving sideways since its May peak in a low volume, narrowing range. This uninspiring action has become quite a bit more positive over the last four weeks and may be signaling the start of a healthy rally.
In late January KLIC was crushed after reporting its Q1 results. The negative news sparked a two day plunge of over 15%. The breakdown was a sharp reversal from the bullish action that had carried the stock sharply higher from its November lows. The day before the company’s report KLIC closed at fresh rally highs. Needless to say, the late January collapse weighed heavy on the stock for months. By the end of April the stock had dropped nearly 25% from its pre earnings high and was finally becoming sold out. The rebound was quite strong during the last week of April and got a major boost from a solid earnings report as the month closed. In May the rally continued but fell short of filling the huge breakdown gap left back in January. The pullback from the May peak ushered in the start of the consolidation that continues this week.
The June sell off ended with a spike low. KLIC was hit hard again that month but remained above its 2013 lows. This began a series of higher monthly lows that includes September, its third straight. Support near $11.00 has proven very solid since early July and has held six weekly lows through the September open. If this area were to give way the near term picture would turn negative. I believe a significant low is in and KLIC is poised for an upside move. Purchases below the $11.50 level are very low risk. On the upside rests a key overhead trendline that links the stock’s May/Jun/August highs. A clear break through this resistance zone, near the $12.00 area, would be very bullish. The major challenge will remains near the still unfilled breakdown gap at $12.70. A pause here is likely, one that would lead to a healthy pullback. Eventually I believe KLIC will make a run at its 2012 high of $13.70. A rally of this magnitude from the August/September lows would match the powerful move that followed the April bottom.
———————–
Long INTC and KLIC
Than ks for reading and stopping by:
Trinity Asset Management, Inc. by:
Brian Gilmartin, CFA
Portfolio manager