The chart of the EEM is getting a lot of chatter on Wall Street. Emerging market economies tend to be commodity-based and with commodities weaker and the dollar stronger, these markets tend to get a sharp wrap on the knuckles when commodities fall and the dollar strengthens. The Indian Rupee has been weak, as has been the South African Rand as well as a handful of other currencies.
Note the increase in the EEM in the earlier part of the last decade, as the SP 500 struggled and the dollar was weak.
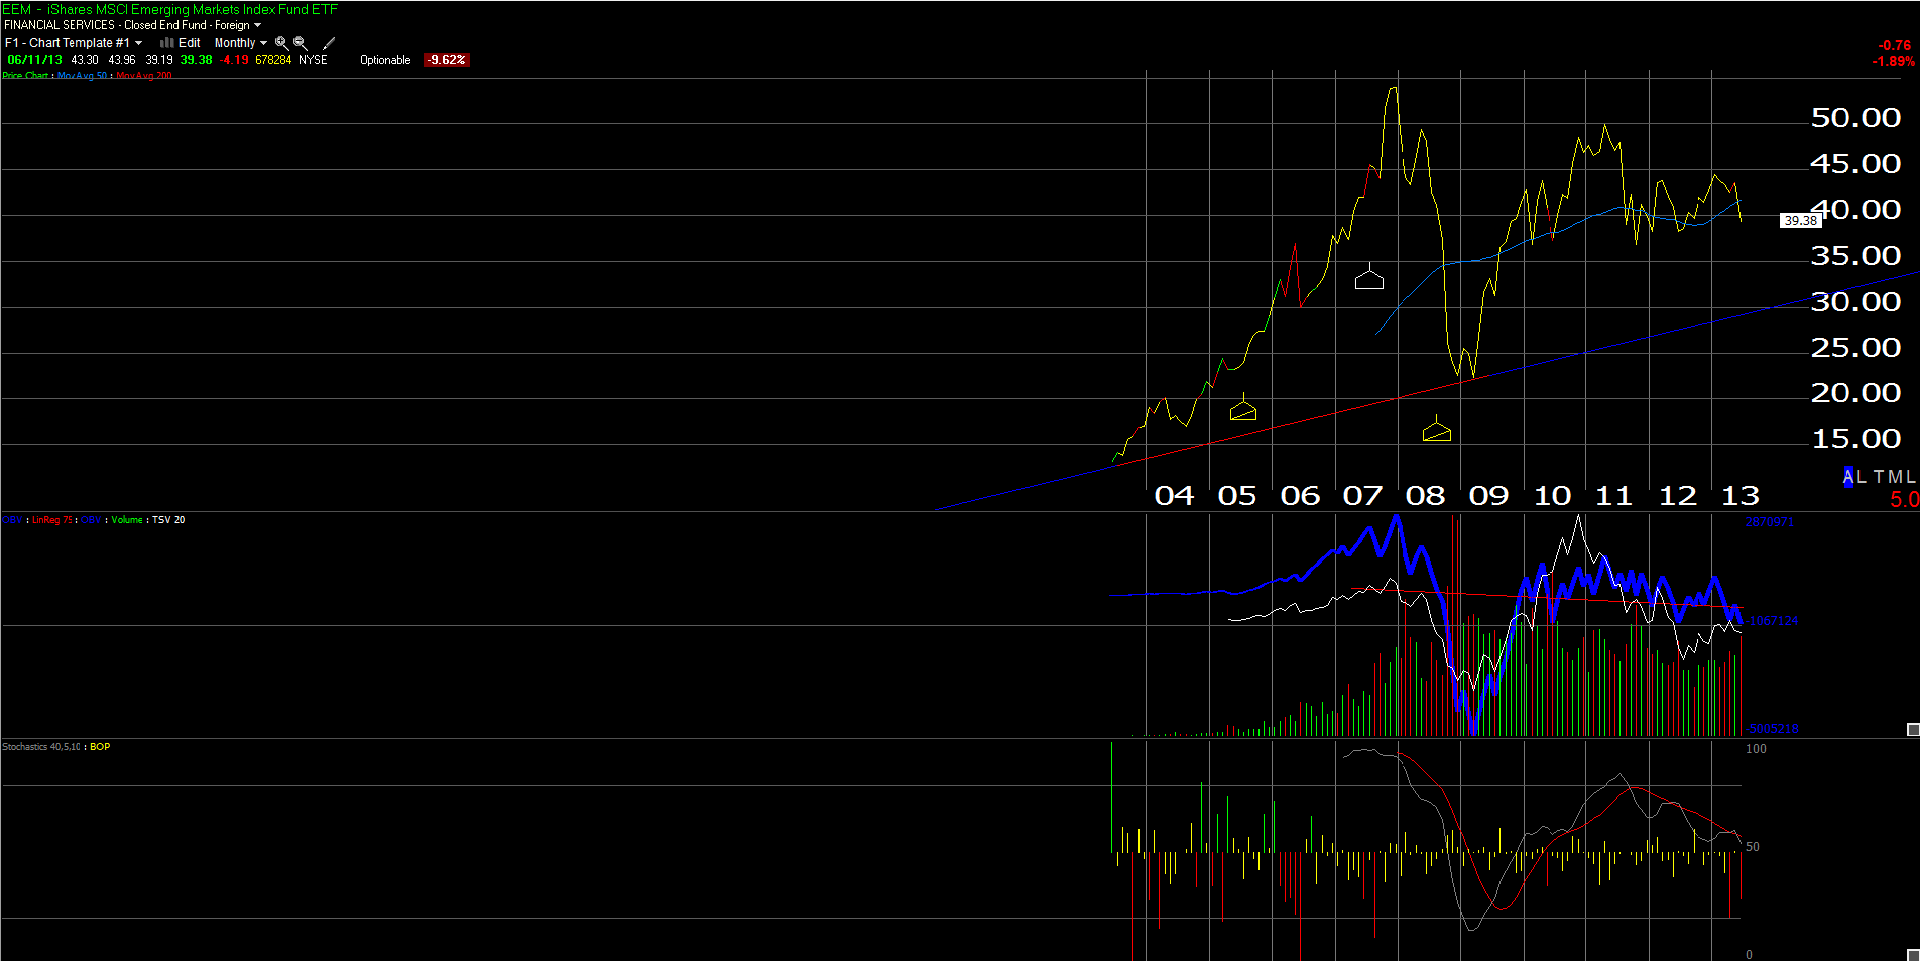
We like the EEM closer to $30 per share, which is near the trendline off the late 2003 IPO.
Thus, we still think emerging markets could gtive back another 25% before being ready to buy. It has been since early 2000, where the USA and the SP 500 have been global leaders. The other element is that we expect the dollar to strengthen over the next few years, hopefully slowly, as US interest rates rise and the US economy continues to strengthen.
The Top 5 holdings of the EEM are Japan, Taiwan and China companies. Samsung is 3.8% of the portfolio and is the largest weight. The Top 5 names are over 10% of the EEM ETF.
We’ll give it time. There should be a lower-risk buy point for the ETF down the road.
Trinity Asset Management, Inc. by:
Brian Gilmartin, CFA
Portfolio Manager