Gary Morrow’s technical commentary: (The chart and comments are 24 hours old due to technical difficulties):
Ford Appears Headed Lower
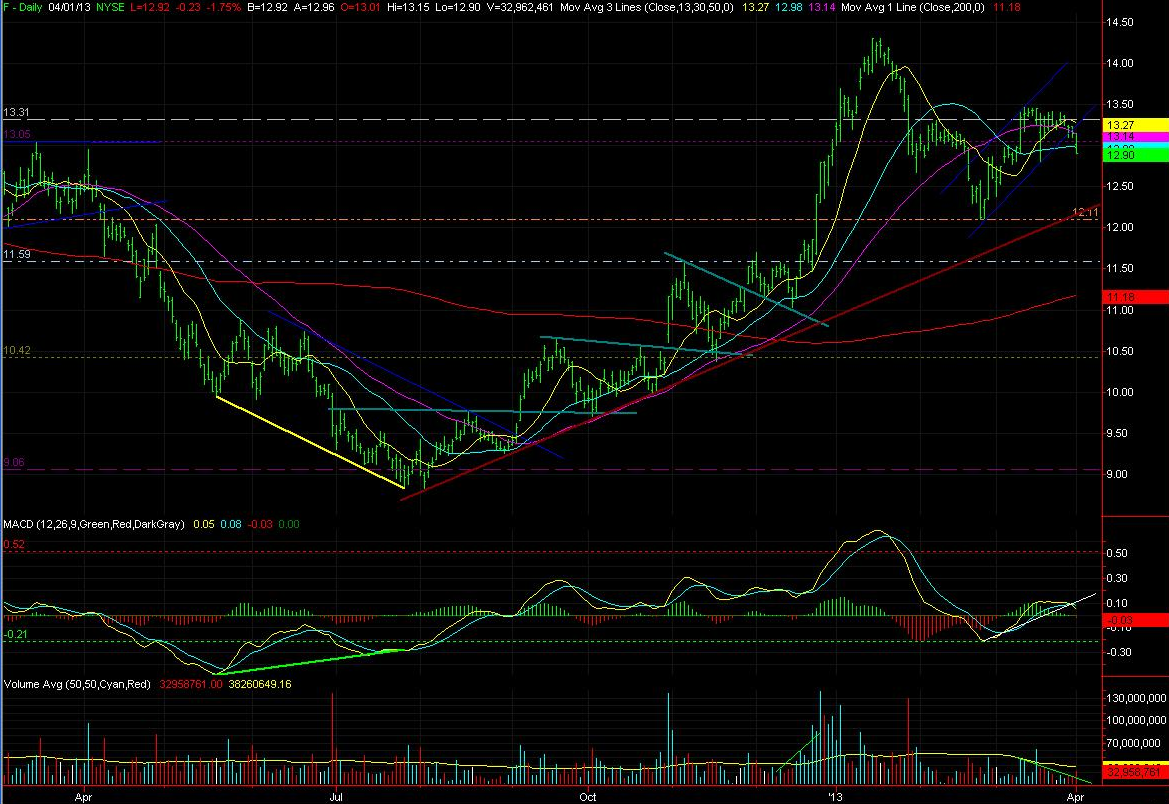
Shares of Ford are beginning to look quite bearish. The stock began this week with a 1.75% drop on accelerating trade. The drop pushed F below the lower band of a six week bullish channel that had been in place since the February 25th lows. Despite overall mild selling pressure since the start of February the price action has weakened since Ford’s 50 day moving average rolled over early last week. With today’s breakdown the stock is sending negative signals heading into tomorrow’s sales numbers.
If the news tomorrow is uninspiring I expect Ford will be headed for a re-test of the 2013 lows. The stock underwent a healthy pullback following the powerful Christmas Eve breakout and by late February shares were dipping below the January lows. The $12.00 area held in well ending the sell-off on February 25th. F mounted a healthy recovery rally which lifted shares past the February highs but the move lacked momentum. I believe this level will be tested again before a new rally can take hold.
The support zone I am focusing on includes the February lows, which approximate a 1/3 retracement of the bull move from last summer’s double bottom, as well as the November/early December highs near $11.60. I believe a fade back down to this area followed by a period of basing action will provide a low risk buying opportunity for Ford bulls. I am long the stock and will be a buyer on weakness. An overreaction to neutral news tomorrow could set the stage for position building.
Another post news scenario is a ramp higher on better than expected results. This would certainly catch quite a few investors by surprise. A surge past the March/February highs on heavy trade would quickly turn the $13.30 to $13.50 area into key support. Once past the previous two monthly highs Ford would be set up well for a run up to the January highs of $14.30.
Fundamental Commentary (Brian Gilmartin)
Fundamentally, Ford (F)’s earnings estimates are getting trimmed, or being revised lower for 2013 and 2014, which isnt what we like to see as management guided to a European loss of $2 billion or $0.50 per share in the 4th quarter, 2012 call.
Ford is trading at 9(x) price to auto-operations cash-flow and 5(x) price to total cash-flow, which is higher than we like, but cash-flow continues to improve. I do think the dividend will continue to increase.
Current 2013 and 2014 EPS estimates are for $1.39 and $1.67 for zero growth in 2013, and an expected 20% growth next year.
Expect any upside surprise to come from US margins, the US auto group, and lower losses than expected in Europe as that region stabilizes. When will that happen ? Hard to say.
Today, Ford (F) has twice the shares outstanding as it did in the early 2000’s, so the $36 – $37 high in mid-1999 might translate into an $18 – $19 peak for this next rally, or where it traded in early 2010.
We are going to remain long Ford in client accounts. Today’s auto sales were a plus, although a lot of it was already in the stock.
I think Ford’s story now is all about Europe and whether management can contain the losses, and how well US auto sales and margins can offset Europe.
Long F
Trinity Asset Management, Inc. by:
Brian Gilmartin, CFA
Portfolio manager
312-751-0996