Fundamental Commentary: although we updated the valuation and near-term fundamentals with yesterday’s chart on Intel, the posting of the weekly chart, necessitates a little more commentary. Our fundamental spreadsheet on INTC goes all the way back to the mid 1990’s, so we have almost 20 years of income statement, balance sheet and cash-flow data on INTC.
Since mid-1996, which is as far back as our spreadsheet goes, and using 4-quarter trailing revenue and EPS data, INTC has grown revenues – on average 11% over those 72 quarters, and EPS +18%. 4-quarter trailing cash-flow growth has averaged 6% over that same time frame.
Hard to believe. Today, you can buy INTC at 6(x) cash-flow or at the 61-quarter average, at a substantially lower p.e ratio too.
INTC is a deep value stock today. The big liability is the capex nut every year: since the late 1990’s, INTC’s capex as a percentage of cash flow has averaged 46%, which is pretty sizable.
No question INTC’s valuation is far cheaper today, with negative sentiemnt surrounding the stock.
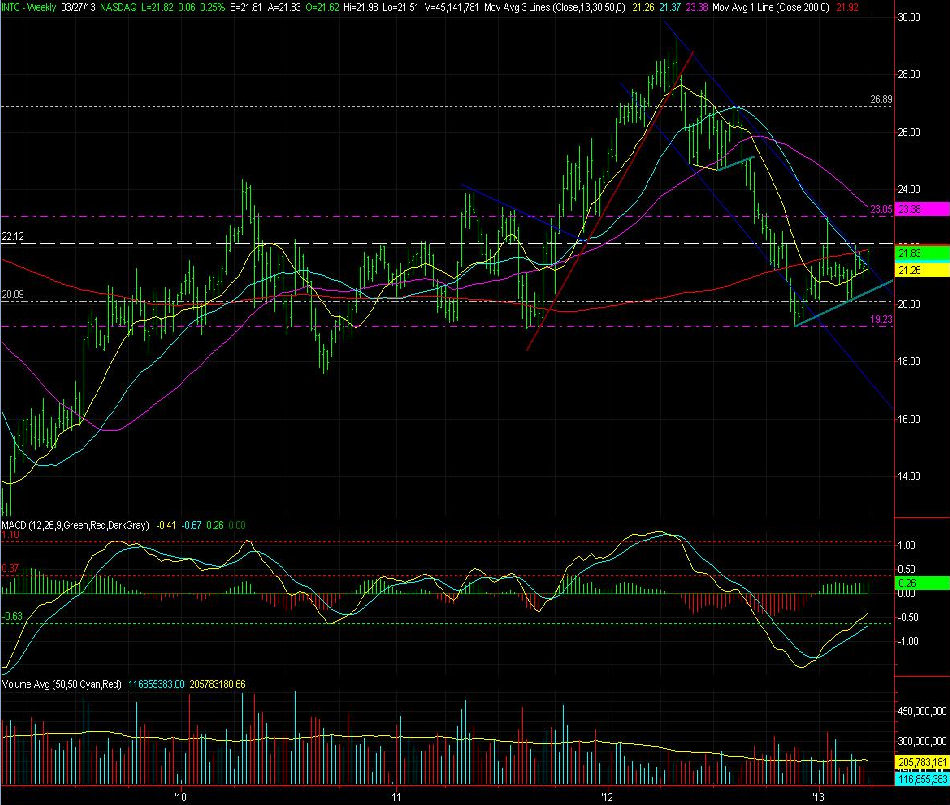
Gary Morrow’s technical commentary:
The weekly Intel chart detailed above provides a much clearer picture of how important the $19.00 to $20.00 area has been since the second quarter of 2011. The seven month bear market that began in early May of last year reached this major support zone Thanksgiving week. From here INTC mounted a solid recovery rally that retraced 1/3 of the last May’s swoon. Since the January 17th spike high the stock has struggled but an emerging base has been forming on the longer term charts. I believe the bullish conditions have improved of late setting INTC up well for further upside.
In the near term the $22.00 area continues to be a hurdle. A weekly close above this level, which includes the huge Jan. 17th breakdown gap as well as the March highs, should be encouraging for Intel bulls. Once through the stock will make a run at the 2013 highs just above $23.00. I would expect the January peak to attract considerable selling pressure. A pullback from this resistance area will be a key test for this young rally leg. At that point the $22.00 area should hold the downside. In the near term I believe last week’s lows are a key level to monitor. A close back below the $21.00 area would indicate much more basing will be needed before a new rally phase can take hold. I don’t expect a drop below here anytime soon and remain bullish on Intel. I am long the stock and will add shares as conditions improve.