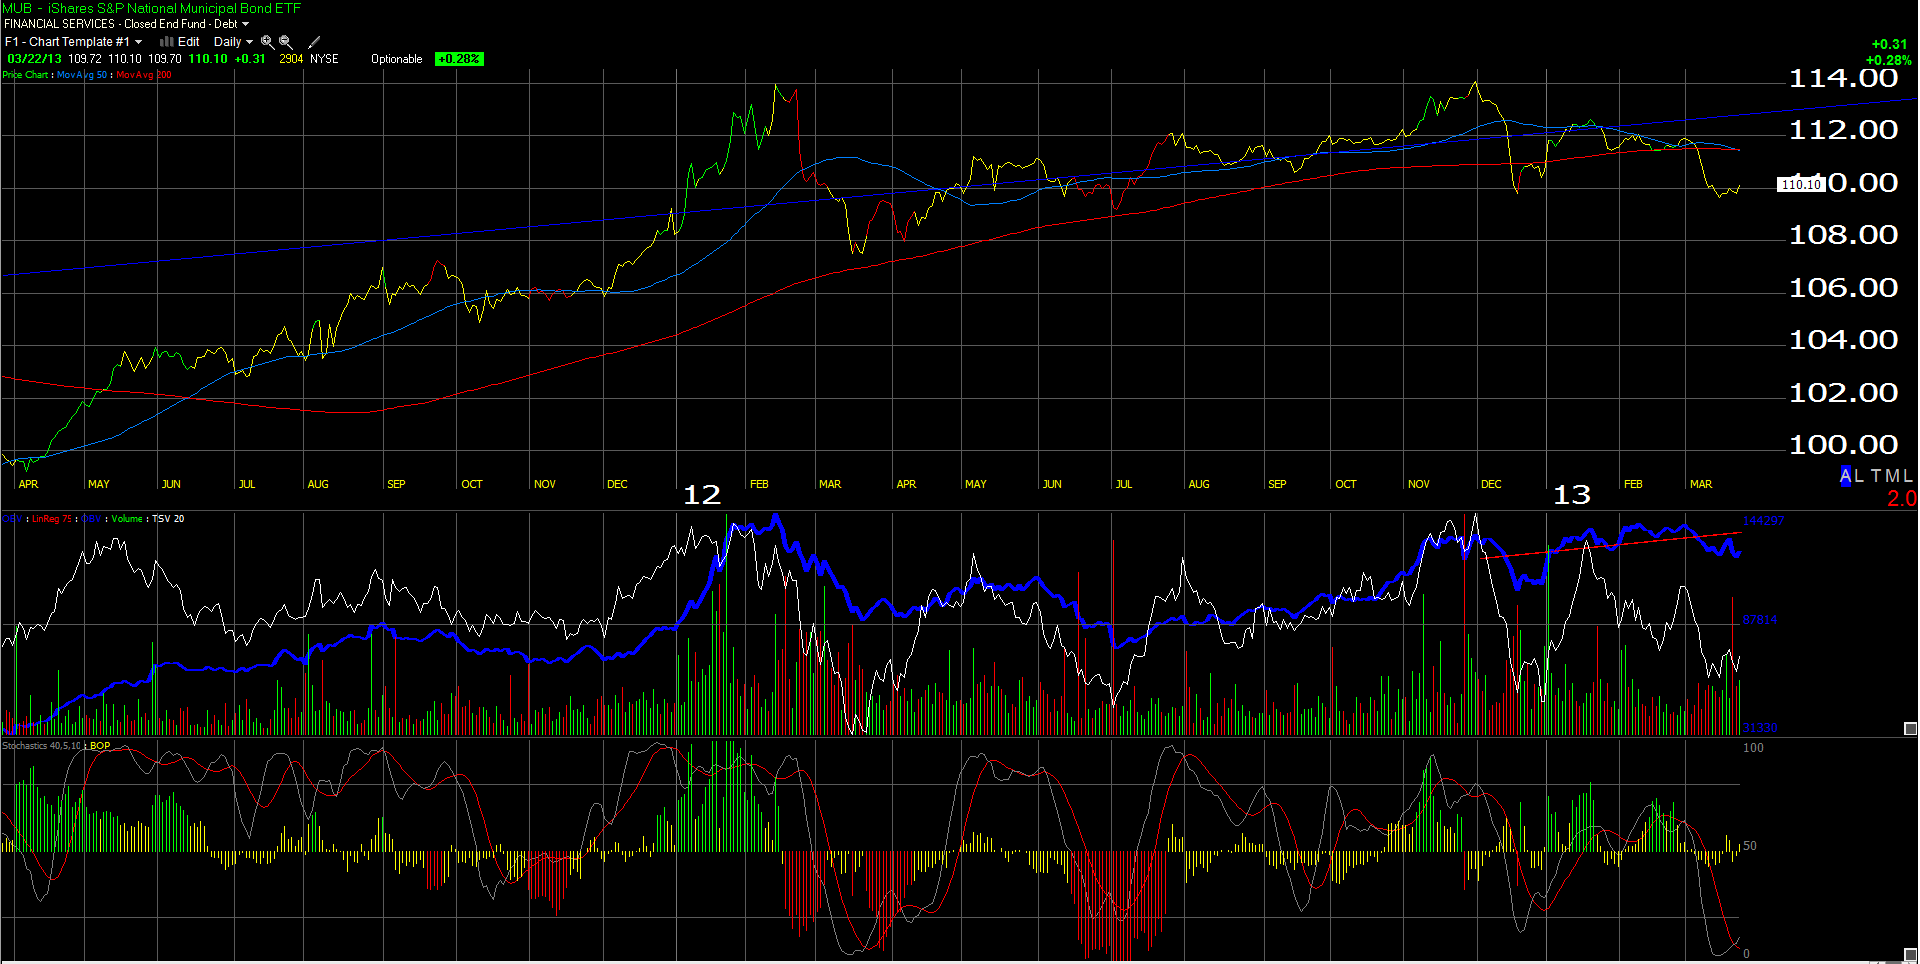
Here is a chart of the National Municipal Bond ETF (MUB) as of Friday, 3/22/13.
With all the higher taxes in 2013, especially the Affordable Care Act, Social Security, etc. etc. you would think the municipal market would be screaming higher, but its really is not, in fact it is quite punk.
However, the MUB chart caught my eye as potentially forming a double-bottom from the December lows. We bought the MUB this morning for a few accounts, with risk to $109. If MUB trades below $109, then it looks to me to be broken, at least for a while.
The MUB yields roughly 2.8%, its effective duration is a little higher than we like at 5.0, and 47% of the ETF is double-AA rated in terms of credit exposure. Keep it on a short leash. The real risk to muni’s is that Congress starts eyeballing the tax-favored status and the muni market loses its tax exemption. That will be interesting.
The trade is more for a risk off equity trade until q1 ’13 earnings start. If the MUB drops in price as equities correct, the trade is definitely wrong.
Long MUB
Thanks for reading,
Trinity Asset Management, Inc. by:
Brian Gilmartin, CFA
Portfolio manager
312-810-3480