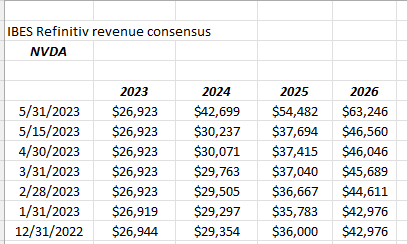
It makes you wonder how much homework sell-side analysts do, when Nvidia (NVDA) markedly increases their revenue guidance for the July ’23 quarter. Data Center revenue and EPS guidance for the fiscal Q2 for NVDA, saw sell-side analysts boost the fiscal ’24 EPS estimate by 69%, and the revenue estimate by 41%. The EPS lift is formidable, but a 41% increase in the revenue estimate ?
Did any analyst not drop a call into investor relations and ask “How is business relative to previous guidance ?” Granted, CEO’s, corporate officers and investor relation departments are often loathe to disclose any material, nonpublic, information given Reg FD (full disclosure), passed under the Clinton Administration when Arthur Leavitt ran the SEC, but analysts can also look at end users and the suppliers and not have to solely rely on the often closed-mouth corporate hierarchy.
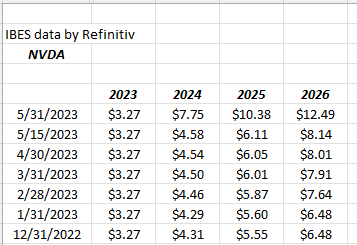
(Nvidia like Walmart has their fiscal Q4 every year at the end of January. So Nvidia’s fiscal q4 ’23 ended January 29, 2023, (even though there was only one actual month of operations in the year 2023) meaning they are currently in the midst of their fiscal ’24. Unfortunately, some analysts still use ’23 as their modeling metric, which can be very confusing.)
According to Briefing.com, Micron Technology (MU) reports June 28th or just prior to prior to quarter end.
Clients have never owned Nvidia directly, but only through the semiconductor ETF (SMH), but what’s fascinating to me is the difference in capex between traditional semiconductor names like Intel (INTC) and Micron (MU), and Nvidia.
50% of Intel’s operating cash-flow is spent on “capex” or fab construction to sustain the economics of the business. Micron, given the slump in DRAM and NAND fundamentals in the last year, spent 122% of 4-quarter trailing (TTM) operating cash-flow on capex as of the February ’23 quarter. (To be fair about Micron, and my model goes back to the 1990’s, at the high point of the DRAM/NAND cycle when pricing and demand are at their highest, capex gyrates around 50% of operating cash-flow, based on the last 12 – 13 years).
Using a sell-side Cash-Flow Statement report, here’s NVDA’s historical and projected capex as a percentage of operating cash-flow:
- 2025: 4% of operating cash-flow; (est)
- 2024: 4% of operating cash-flow; (est)
- 2023: 7% of operating cash-flow; (est)
- 2022: 32% of operating cash-flow;
- 2021: 10% of operating cash-flow;
Technically, Intel, Micron and Nvidia are semiconductor companies, but world’s apart fundamentally.
Interest rates and corporate credit:
It was very surprising to see a muted reaction to the nonfarm payroll growth of 339,000 on Friday morning June 2nd. The 10-year Treasury fell almost a point in price, on Friday, June 2nd, but price was higher on the week. You’d think it would be much worse given all the talk about the FOMC pausing fed fund rate hikes the last month, and then seeing the surprisingly-strong nonfarm payroll growth.
According to fed funds futures this weekend, (CME Fedwatch tool), there is still a 74.7% chance of the FOMC maintaining the current fed funds range of 5% – 5.25% on June 14th. CPI and PPI data come out next week, or June 13th and 14th, so the FOMC will be meeting when the next key inflation gauges are released.
High-grace corporate and high-yield corporate asset classes had a good week, which you’d expect given the strong payroll data, with high-grade corporates YTD return improving 107 bp’s (in terms of total return) to 2.69% as of Friday, June 2nd, versus the YTD return of 1.62% on May 26th.
According to the Bloomberg data, high-yield performed even better, returning YTD 4.53% as of Friday, June 2nd, versus the 3.34% YTD return as of May 26th, or an 119 bp improvement on the week.
Corporate high yield has been a very good tell since June of ’22 in terms of an “early-warning recession indicator”. As of June 30, 2022, high yield was underperforming the Barclay’s Aggregate (AGG) by 400 bp’s (-14% vs the Agg’s -10%), but by year-end 2022, corporate high-yield was down just -10.99% as of 12/31/22, versus the Agg’s full-year drop of -12.98%. (Return data sourced from Bloomberg.)
This article dropped on this blog in July ’22, was (possibly) helpful to readers, but individual corporate bonds are not bought for clients, given that liquidity is the silent killer of the corporate and structured bond markets, and thus I’d rather own ETF’s and mutual funds for clients to avoid that “individual security” risk, which is bad enough in the equity market.
SP 500 data:
- The forward 4-quarter estimate (FFQE) this week ended at $225.50 vs last week’s $224.71. It doesn’t seem like much but that’s a larger-than-normal sequential increase for the FFQE.
- The PE ratio on the forward estimate is 19x this week, vs 18.6x on 3/31, and 17x on 12/31/22;
- The SP 500 earnings yield is 5.27% vs 5.37% on 3/31/23 and and 5.80% on 12/31/22;
Rate-of-change of forward estimates:
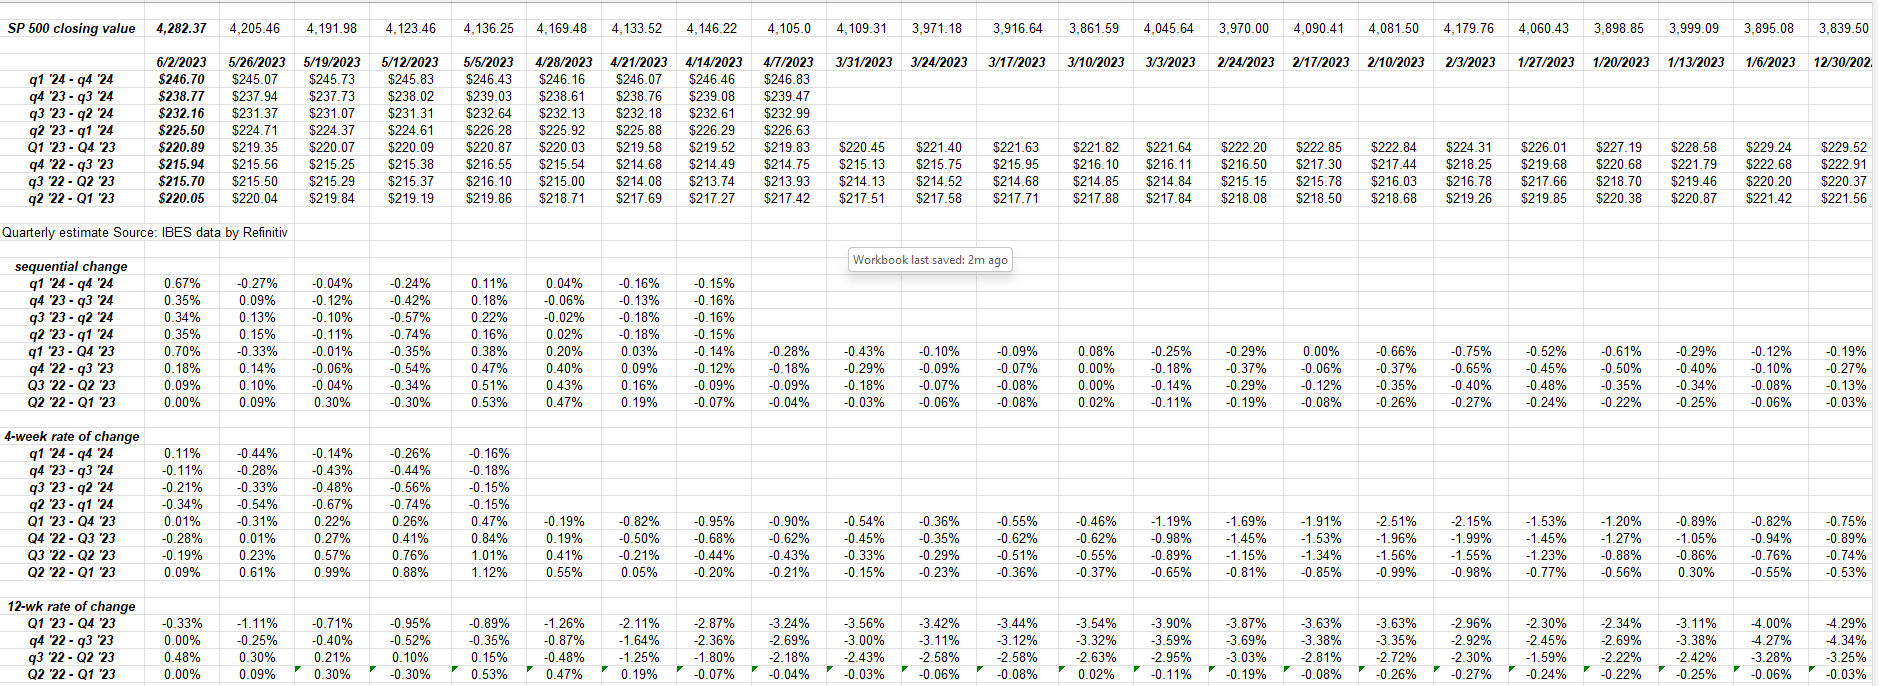
This spreadsheet is compiled from the SP 500 “forward estimate” curve. The sequential and 4-week rates of change are firming up. The 12-week rate of change won’t be available until July 1 ’23, since the 2024 bottom-up estimates aren’t provided each year until April 1.
Summary / conclusion: Eventually this weekly SP 500 earnings update will be revamped or revised since – over the years – there are longer periods where nothing really noteworthy happens to SP 500 estimates. Nvidia’s earnings release is a shining example of how SP 500 EPS and revenue estimates can stay on autopilot without any of the 47 sell-side analysts covering Nvidia actually doing any homework or making an effort to update their models. My goal each week is to try and highlight something interesting about SP 500 earnings, or sector earnings revisions and changes, but that is not always available.
Looking at the “rate-of-change” table above, as the various rates-of-change turn positive, that SP 500 earnings could be revised higher (again), but we’ll only know that when Q2 ’23 earnings start in mid-July ’23. We’ll hear from Fedex (FDX) and Nike (NKE) and Micron (MU) and Oracle (ORCL) before the end of June, but we don’t get the flood of earnings for another 6 weeks.
There are a few ideas of how the SP 500 earnings data can be made more interesting, and we’ll see how they are received.
Despite Nvidia’s earnings and the reception around Q1 ’23 technology earnings, the sector is still looking for flat or 0% earnings growth for 2023, which is the most interesting metric (in my opinion ) in terms of the divergence of how stocks trade versus what the numbers show.
Corporate credit trading often dovetails with SP 500 action. Tightening credit spreads and higher YTD returns for both high-grade and high-yield corporates tends to generate positive forward returns for the SP 500 over time. It isn’t a perfect correlation, but it’s definitely a symbiotic relationship.
Take this all with substantial skepticism. The blog is one person’s opinion, and past performance is no guarantee of future results. None of what is written is advice either. Capital markets can change quickly and investing involves loss of principal. Each reader should gauge their own appetite for volatility.
Thanks for reading.