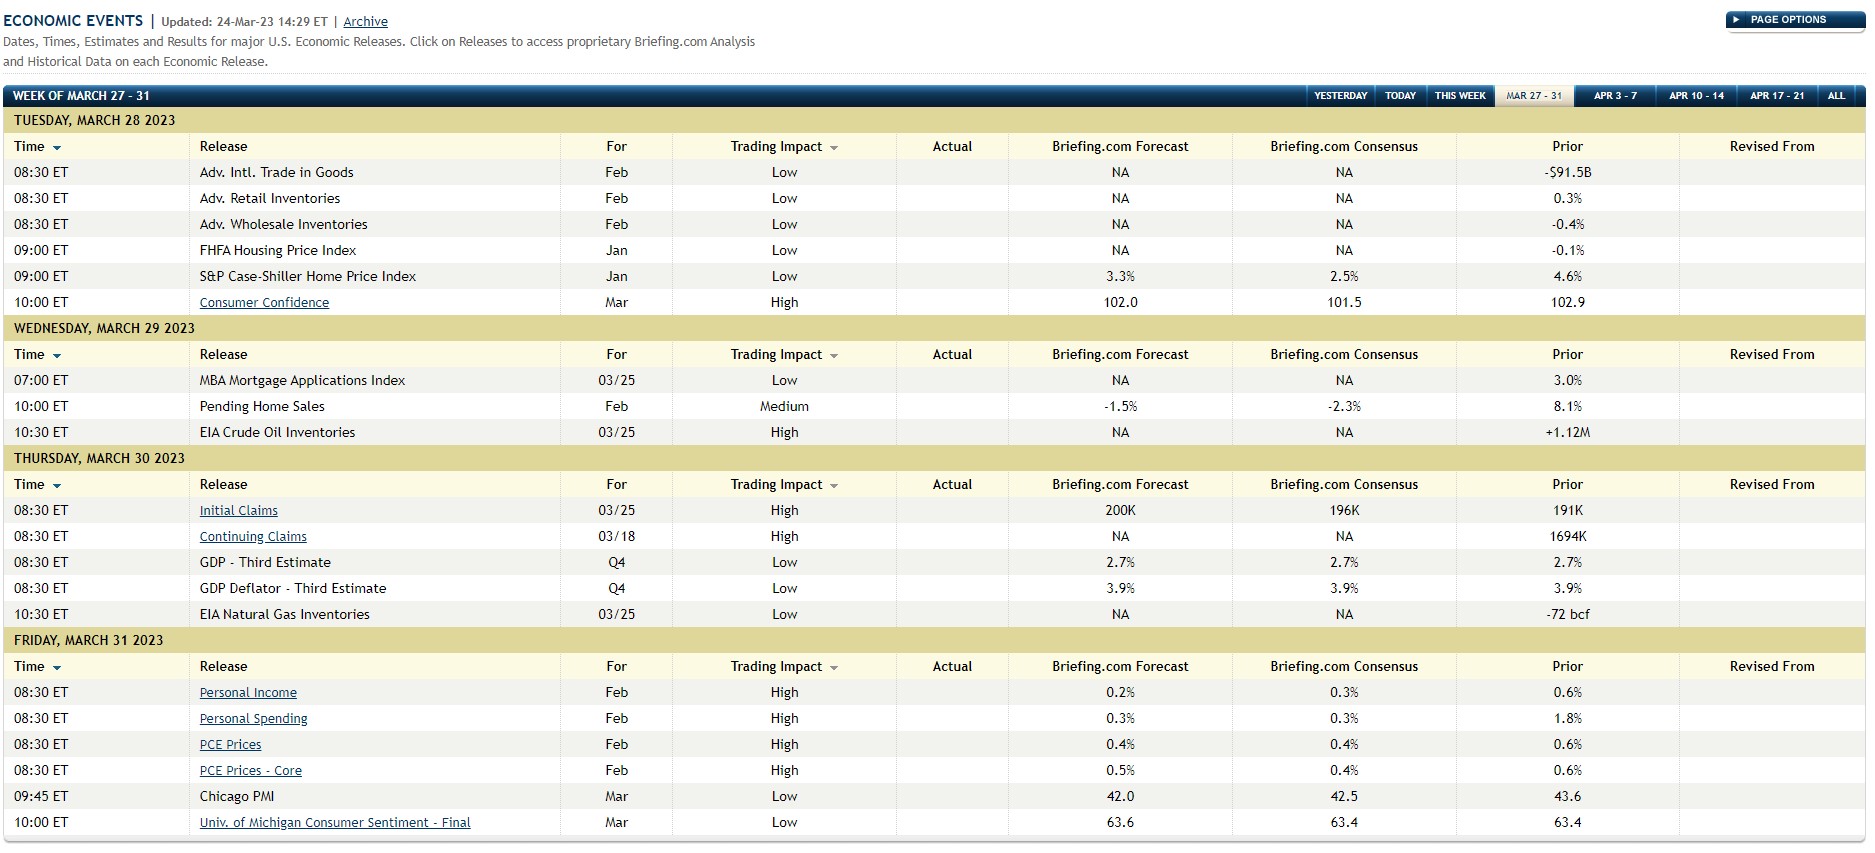
Here’s the list of pending economic data to be released this final week of March ’23 (from Briefing.com), and while the final Q4 ’22 GDP estimate and the GDP deflator will get a lot of lip-service, the big data point this week will undoubtedly be Friday’s PCE deflator data for February ’23, now almost a month old.
It’s an entirely different discussion for readers, but it still shocks me that the compilation and release of economic data in America today, with an economy $23 trillion in size, and as technologically-advanced as it is, still seems to be in the dark ages. The Atlanta Fed through the GDPNow platform, has been somewhat forward-looking and transformative, estimating the current quarter’s GDP by extrapolating current economic releases, so that’s a big step forward, but it still shocks me that economic data is compiled and released the way it is, and often revised much later thanks to “benchmark revisions” (much of which I don’t understand).
Note the PCE forecasts by Briefing.com forecast as well as consensus.
But don’t forget to read this too:
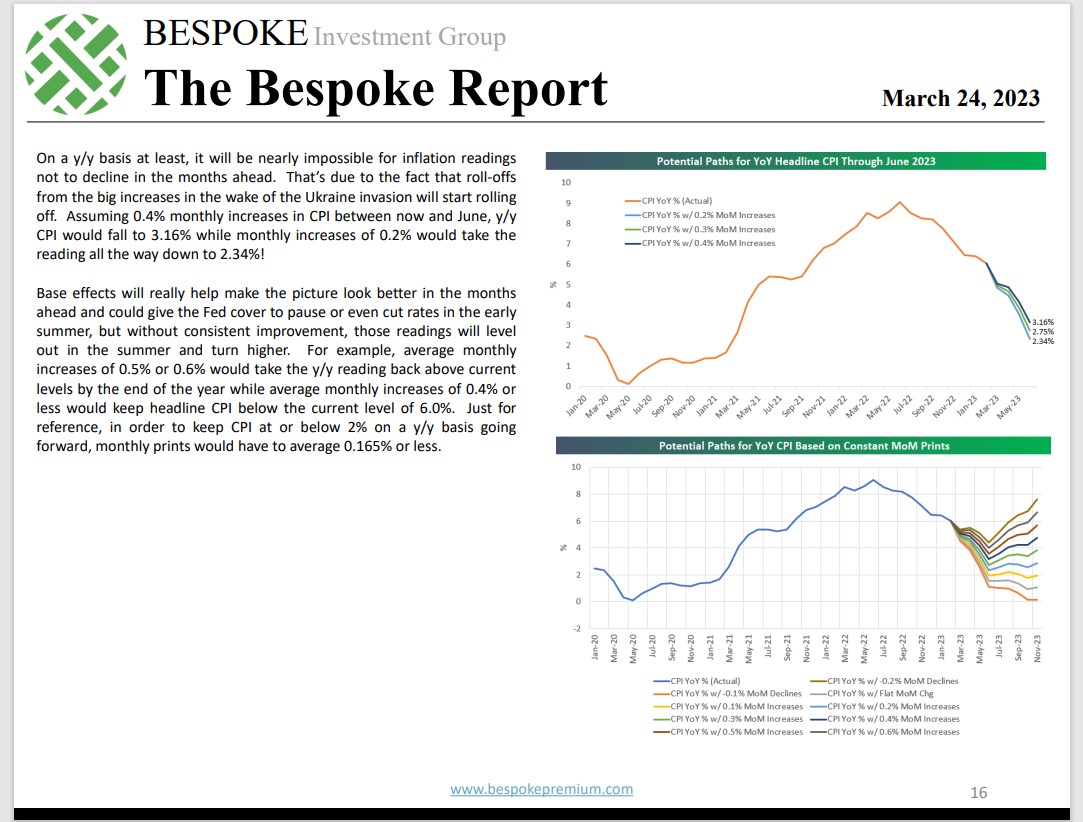
This weekend’s Bespoke Report did a deeper dive on the inflation data and this last page of Bespoke’s inflation analysis pretty much sums it up in terms of what readers might expect over the next few months.
Dr. David Kelly at this week’s JP Morgan Investment Forum in Oak Brook, Illinois this past week, said something very similar about “expected” inflation data both through June ’23 and then for the last 6 months of the year.
Both Bespoke and Dr. Kelly do high-quality work with enviable track records, which leaves me wondering why Jay Powell is saying the fed funds rate reductions are not even in the FOMC’s “base case” scenario ? Fed funds futures are already expecting reductions in the base rate by July ’23.
The Headlines vs the Reality of this Market:
Here’s a list of securities and ETF’s / funds tracked every week and their YTD returns:
- SPY: +3.88%
- AGG: +3.77%
- 60/40% portfolio: +3.84%
- QQQ: +16.93%
- SMH: +25.47%
- AAPL: +23.5%
- MSFT: +17.28%
- JPM: -6.11%
- BRK.B: -3.23%
- XLF: -8.94%
- XLE: -10.04%
Technology (XLK) +17.24% YTD, Consumer Discretionary (XLY) +9.73% YTD, and Communication Services (XLC) +18.24% YTD, are trouncing the YTD return of the SPY.
The total market cap weight of Technology, Discretionary and Communication Services is 44% of the SP 500.
If you turned off the financial media, and just watched “price”, would you think the general market consensus would be bullish or bearish ? Not asking readers to draw any conclusions from this, simply asking a question.
KRE vs FRC:
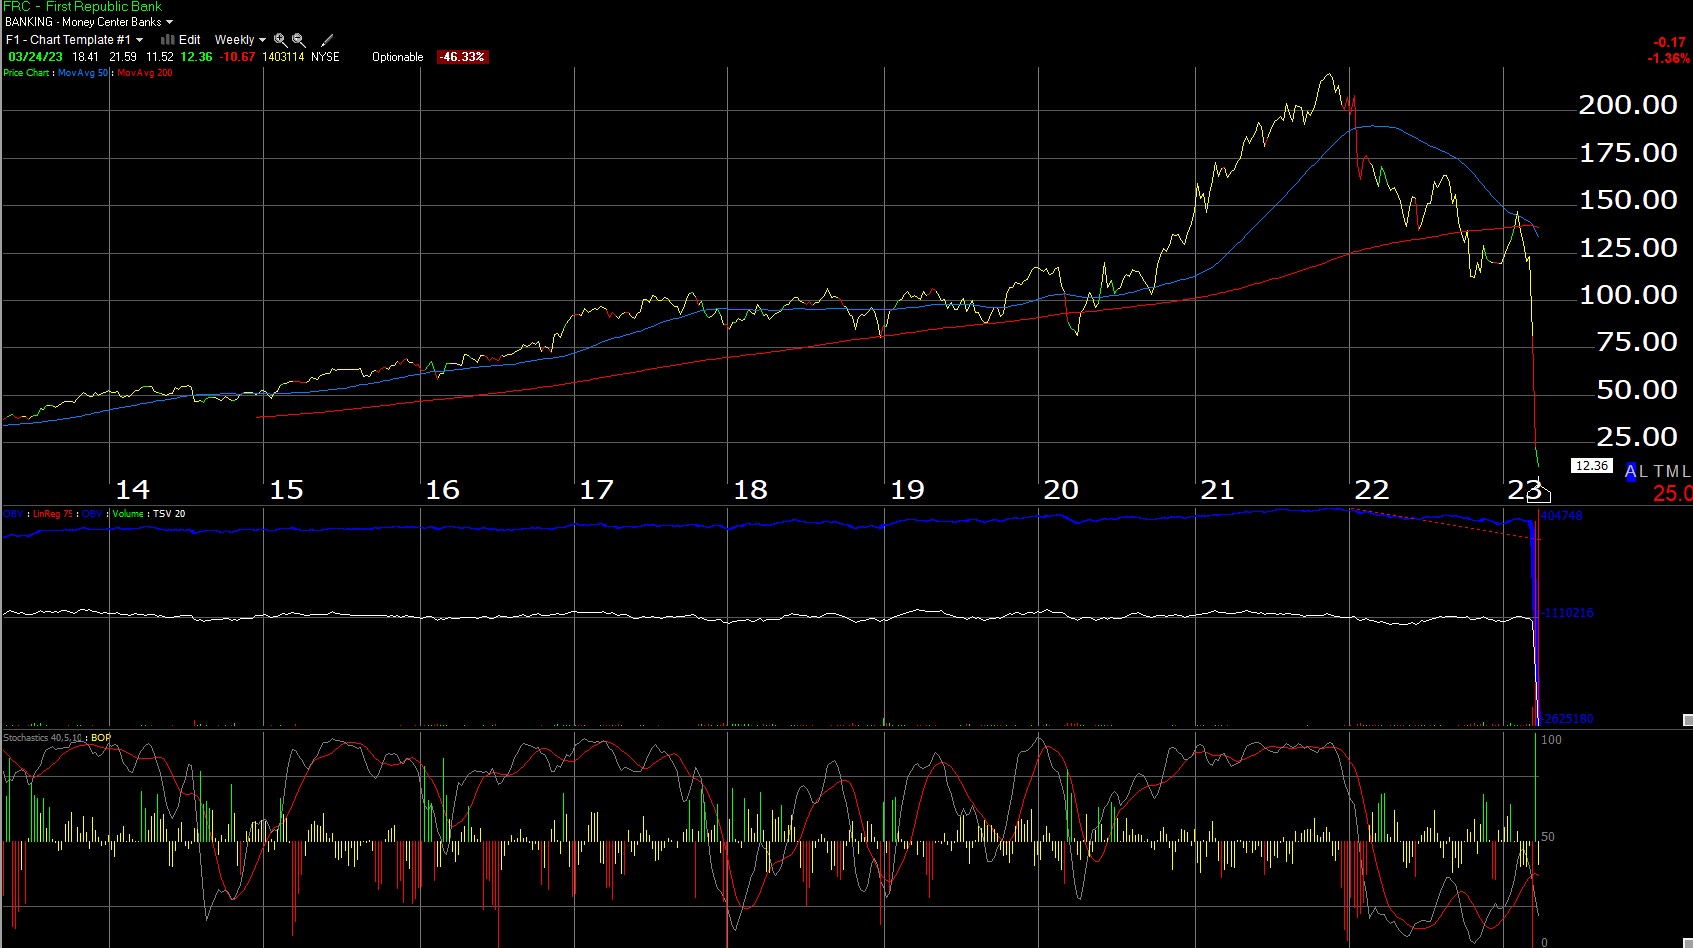
The above is the weekly chart of First Republic Bank. It lost -46% last week.
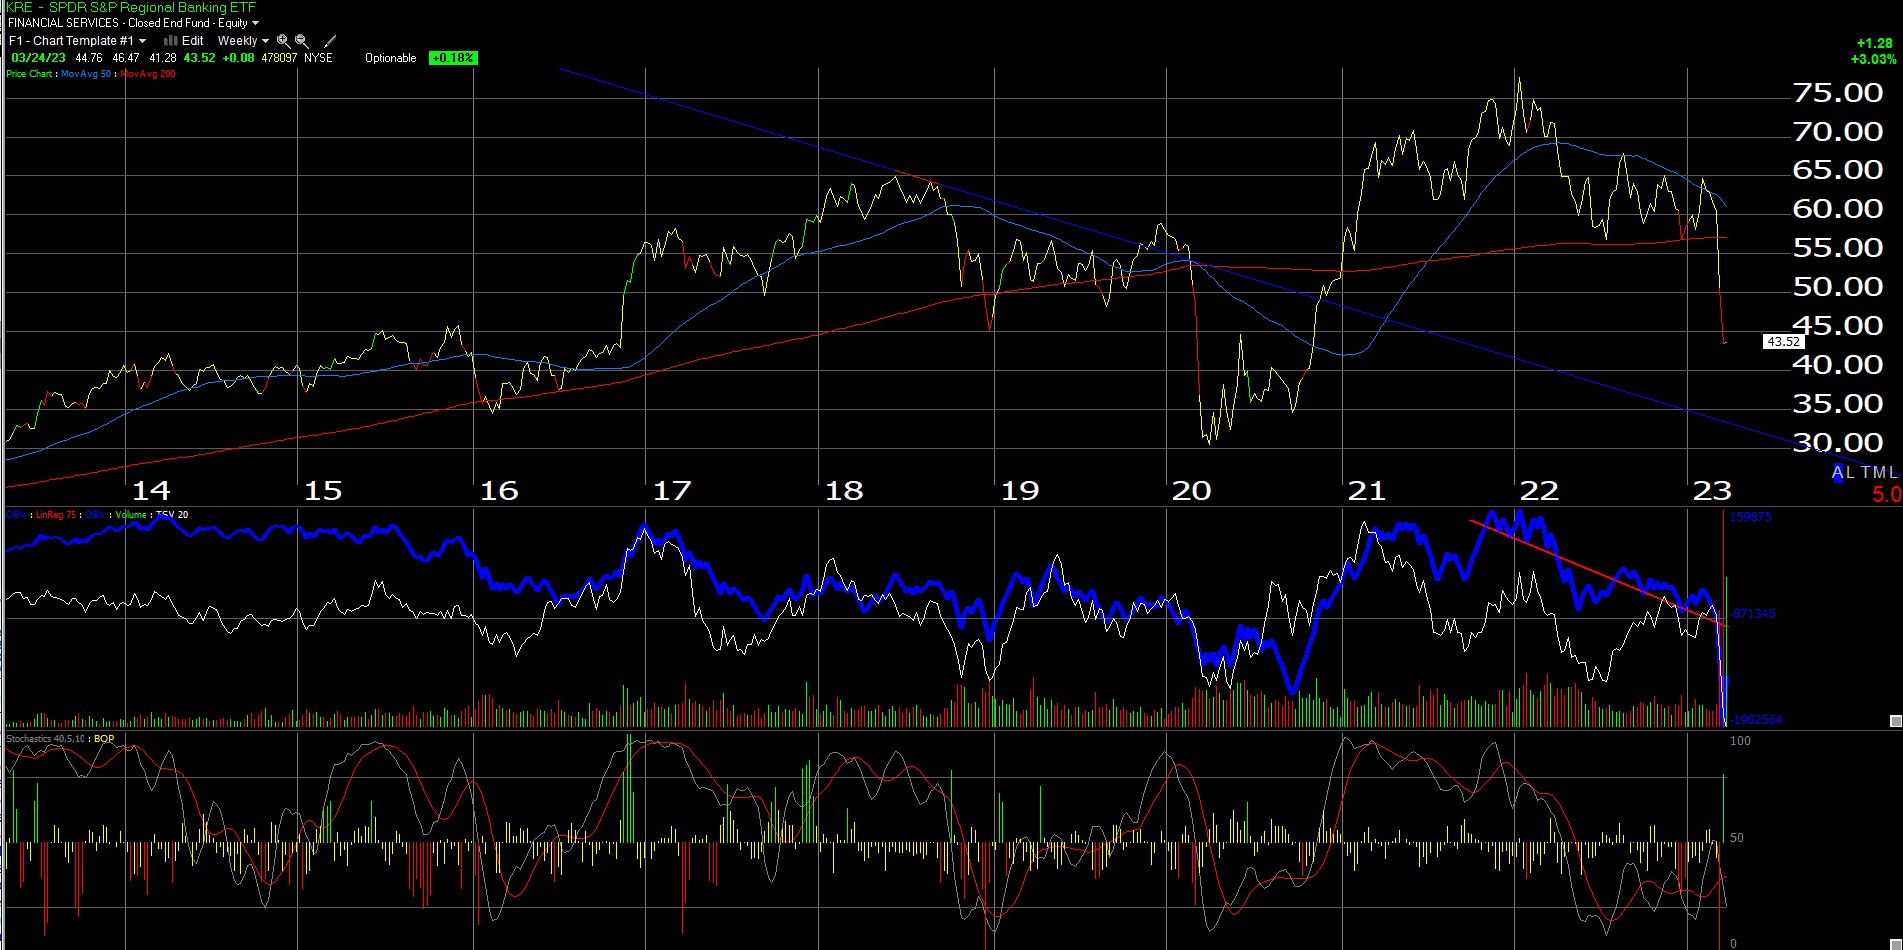
This second chart is the weekly chart of the SPDR KRE ETF or the regional bank index ETF. It was +0.18% last week.
Finally, we may be seeing some differentiation in the wide-scale selling of the regional bank sector. (Long some KRE, owned for a while, not a material holding in any account. Just waiting. The Fed’s discount window should help regional banks with held-to-maturity unrealized losses.)
Summary / conclusion: Friday’s February ’23 PCE release is due out Friday morning, March 31, so prepare for some trading action this coming Friday. After listening ot Bespoke and David Kelly, who are saying the same thing different ways, prepare for the “inflation” argument to subside, and I do expect the Fed to cut rates sooner rather than later.
The early conclusions read about the current banking “crisis”:
- 1.) Community credit will tighten;
- 2.) Bank capital ratio’s will have to be boosted again (it’s the regulators only response to anything negative);
- 3.) Banking is going to get more expensive;
I bet if you asked 100 American’s hanging out around the NYSE this week, only 1 or 2 would guess that Energy is having a worse year than Financials.
The power of the media.
Yesterday’s post noted the big divergence between earnings expectations for Technology and the YTD sector performance for the Q’s and the semi’s.
No predictions here, but technically the SP 500 and the Nasdaq look to be in good shape. Good technicians have noted all year the underlying support for the SP 500 below current levels. Friday, March 24th’s action was very interesting – looking at the open, you’d think we were doomed but by the close, a lot of green on the screen.
Take everything you read here with substantial skepticism. Past performance is no guarantee of futures results and any information provided may or may not be updated and if it is updated, may not be done in a timely fashion. Capital markets can change quickly both positively and negatively for many reasons.
Thanks for reading.