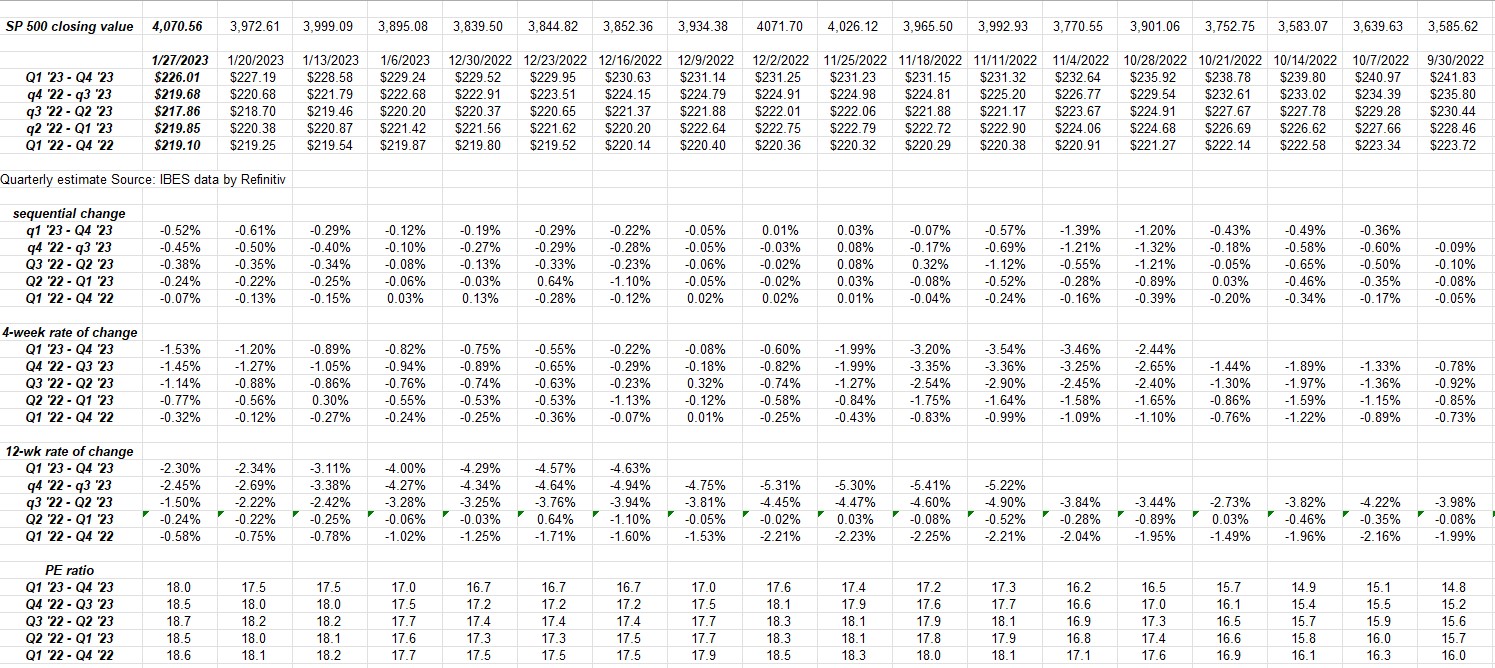
Rather than bury the lede, this table is catching my interest since it a.) looks at the forward SP 500 EPS estimates, and b.) measures the rate-of-change for said estimates over time.
The 12-week rate-of-change shows the negative EPS estimate revisions becoming less severe, BUT note how sequential and 4-week rates of change the last two weeks have become a little more severe.
Hence, with the mega-caps like Apple, Alphabet and Amazon reporting this coming week, and with Apple not only having the SP 500’s largest market-cap weight at 6.3% but an earnings weight that’s likely bigger than it’s market-cap weight, these earnings matter to the SP 500 EPS revisions.
Apple is the big dog in the yard.
The forward EPS estimate revisions should break one way or the other after this coming week.
Given price action and market breadth, I’m still leaning positive for the SP 500 to definitely break the downtrend line in place since January ’22.
SP 500 data:
- The forward 4-quarter estimate (FFQE) slid again this week to $225.02 from last week’s $225.23 and the 9/30/22 $230.43;
- The PE ratio on the SP 500 jumped to 18x this week after the weekly 2.5% rally, up from the 17.5x last week, and the 15.5x from 9/30/22;
- The 5.53% SP 500 earnings yield has declined for 4 straight weeks after peaking near 5.86% on January 6th, 2023;
- The Q4 ’22 bottom-up estimate slid one single penny this week to $53.26 from $53.27 a week ago. The same estimate was $57.91 on 9/30/22;
One red flag:
This data is updated weekly from Refinitiv’s This Week in Earnings report.
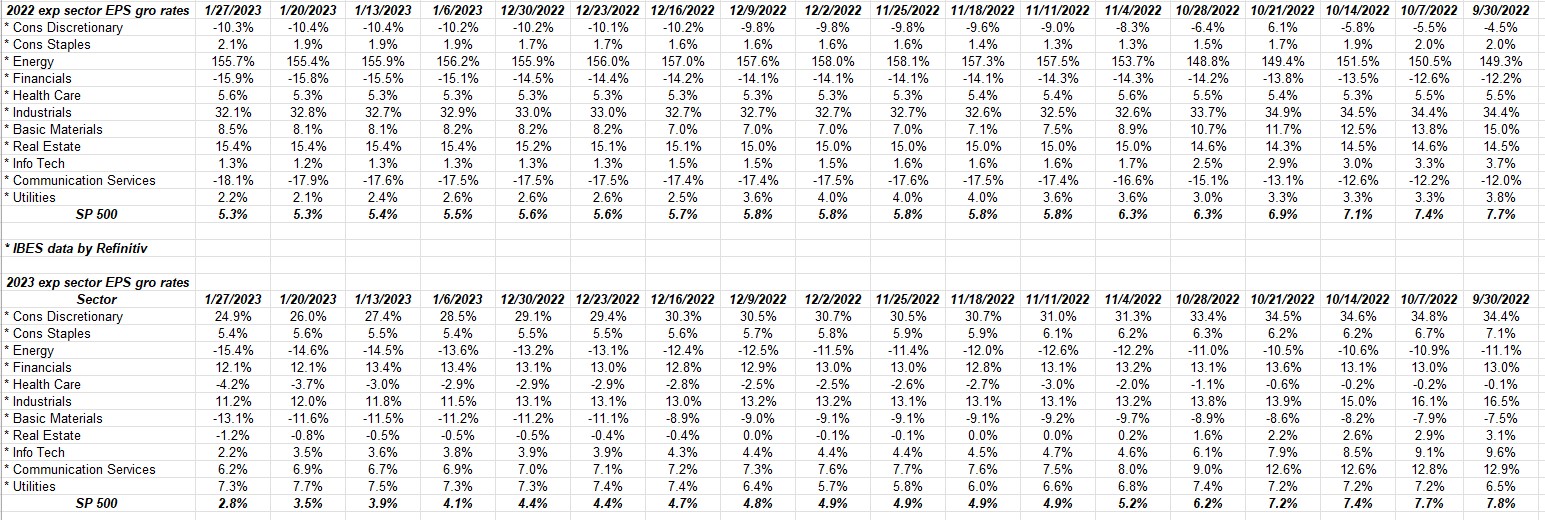
Note how 2023’s expected SP 500 EPS growth rate has slid to just 2.8% as of this week.
That 2.8% expected full-year 2023 growth rate is a full 65% decline from 9/30/22’s +7.8% expected growth rate. Obviously, that number is influenced by revisions, so let’s see what the EPS revisions look like after this coming week.
Mega-caps this week:
Refinitiv data shows that Apple, Amazon and Alphabet all report after Thursday’s market close on Thursday, February 2nd, 2023.
Those three companies represent about 10% – 11% of the SP 500’s market cap as of last night’s market close.
Top 10 Holdings as of 12/31/22 (and ’22 return):
- Blackrock Strategic Income: -6.23%
- RSP (equal-weight): -11.62%
- JP Morgan Income Fund: -8.26%
- Charles Schwab (SCHW): -1%
- Microsoft (MSFT): -27.94%
- Schwab money mkt: +1.40%
- JP Morgan (JPM): -12.79%
- Oakmark International: (OAKIX): -15.65%
- Merck (MRK): +48.4%
- Barclay’s AGG: -13.02%
- SP 500 index (SPY): -18.17%
- EM ex-China ETF (EMXC): -19.56%
Summary / conclusion: There is a 98% change the FOMC hikes rates by 25 bp’s at this Wednesday’s February 1 ’23 announcement, at least as of this morning’s CME Fedwatch tool.
The bigger question i’m wondering about is can the SP 500 break that downtrend line that every technician been focused on, even with poor SP 500 earnings ? And what wins out in the end – poor SP 500 earnings or a less hawkish Fed ?
Jay Powell and the FOMC have engineered a softer landing than even three months ago seemed unlikely, with this morning’s PCE data coming in inline and lower again year-over-year.
Inflation is becoming less of an issue but it’s not been completely eradicated.
Jay Powell could very well remain hawkish at this week’s Fed presser.
Take all this with substantial skepticism. It’s one person’s opinion and past performance is no guarantee of future results. IBES data by Refinitiv is the source of the earnings data, but the spreadsheets and tables are this blog’s work. Capital markets can and do change quickly and in ways not often anticipated.
Thanks for reading.