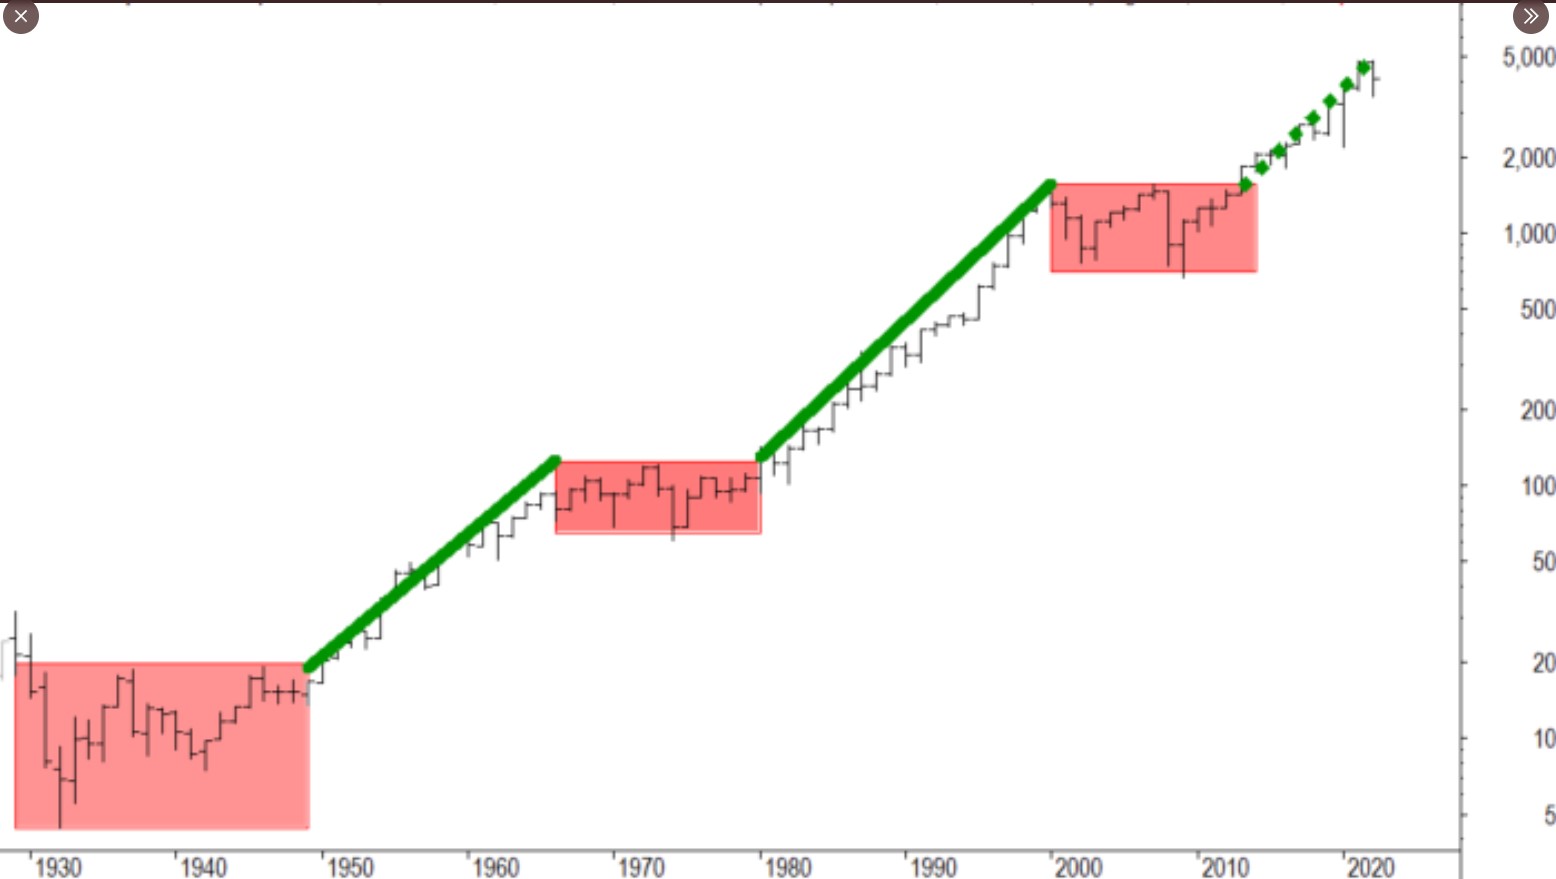
The above chart – from 1930 through the current period – is from a gentleman that can be found on Twitter under the moniker @thechartist, and what struck about this chart this gentleman posted was that he also noted that if early January ’22 was the all-time-high for the SP 500, then this would be the shortest secular bull market in history, a theme that has been all but absent from CNBC and the other major financial news networks.
When this blog post on “annualized returns” was written and posted in early October ’22, one of the bullet points noted that – after peaking in March, 2000 – the SP 500 didn’t make a new all-time-high until May, 2013, which means that if this secular bull market peaked in January ’22, it would be 4 years shorter than the last secular bear market from March, 2000, through April, 2013.
Think about that.
Last week, JP Morgan held a webcast discussing their long-term capital market assumptions (LTCMA). The same webinar a year ago noted their LTCMA for ’22 was +4.3%, while it has now been raised to +7.2% based on – my interpretation – the improvement in nominal yields in the bond market, and the tempering of the annualized returns in the equity market.
Rick Rieder the great Blackrock fixed-income CIO did his monthly Thursday morning 7 am bond call this morning (hasn’t held one in a while, to my knowledge) and he published this table on p. 18 of the slide show:
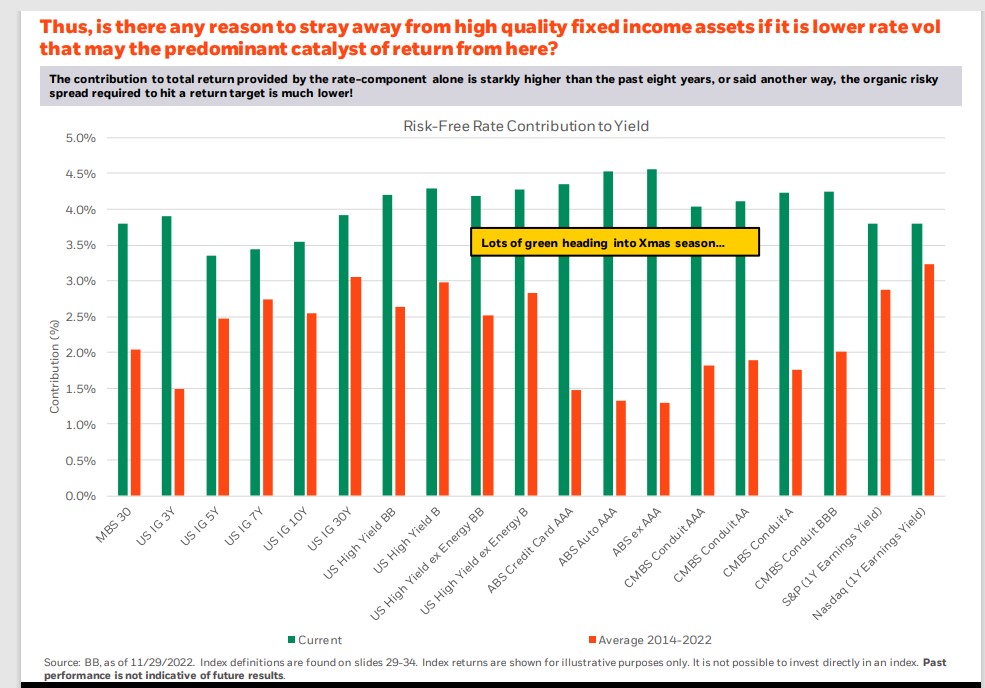 While it’s been a tough year, the Federal Reserve has done investors an enormous favor in terms of the attractiveness of a wide swath of fixed-income asset classes that today look a lot more attractive than a year ago.
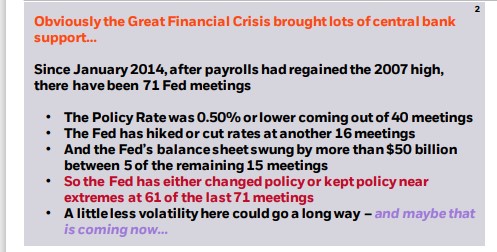
Another notable part of one of Rick Rieder’s slides was this note about volatility and what it could mean to interest rates and credit spreads if 2023 was just more tempered and less “robust” from a monetary policy perspective. Jay Powell and the FOMC did raise the fed funds rate 4 separate times in the last 6 months (has a Fed ever hiked rates that aggressively in its history ?), and will likely do at least 50 bp’s next week.
Most readers are likely more interested in prospective stock market returns and the one asset class I find very interesting is non-US or international assets.
When crude oil fell from $100 in September, 2014, to $28 per barrel by Q1, 2016, at that point the 10-year return on emerging markets had gone to zero. The emerging market asset class had a very robust 2017 and then petered out after that. In hindsight looking back at emerging markets from the start of this century it’s clear that China GDP growing at 10% – 15% per year from 2000 through the early part of last decade drove a lot of the emerging market returns. Clients will never own China again, for any reason, but the “emerging markets ex-China” (EMXC) ETF has a growing weighting in accounts. Oakmark International (OAKIX) remains a large holding, which is being supplemented with the Vanguard ETF’s VEU (all world EX US) and VEA (Developed Markets).
With the dollar finally breaking, although it is currently near it’s 200-day moving average, historically after it’s very bullish run (even stronger than it’s 2000 to 2002 bull run), it typically continues to weaken and this would encourage a non-US overweight in investment accounts.
The real attraction though for Non-US assets including emerging markets is that the 10 and 15-year annualized returns are between 1% and 2% for 15-year annualized, and a little bit higher for the 10-year annualized. Amongst the ETF’s tracked, we threw Oakmark International in there ( a mutual fund) and David Herro had the best 10-year and 15-year annualized returns, only beaten in the 10-year track by the iShares MSCI ACWI (ACWI), which doesn’t have a 15-year record.
In terms of the US equity markets and asset classes, if you’ve been reading this blog’s “style box updates“, the best value seems to be in small and mid-cap asset classes while large-cap growth, given it’s extended period of above-average annual returns, will probably not fall apart as many expect like 2001 and 2002, but could simply be in for a period of “blah” returns. If there was one sector of the stock market that benefitted hugely from Covid and the lockdowns and work away-from-home, it was large cap technology and now we are seeing the hangover.
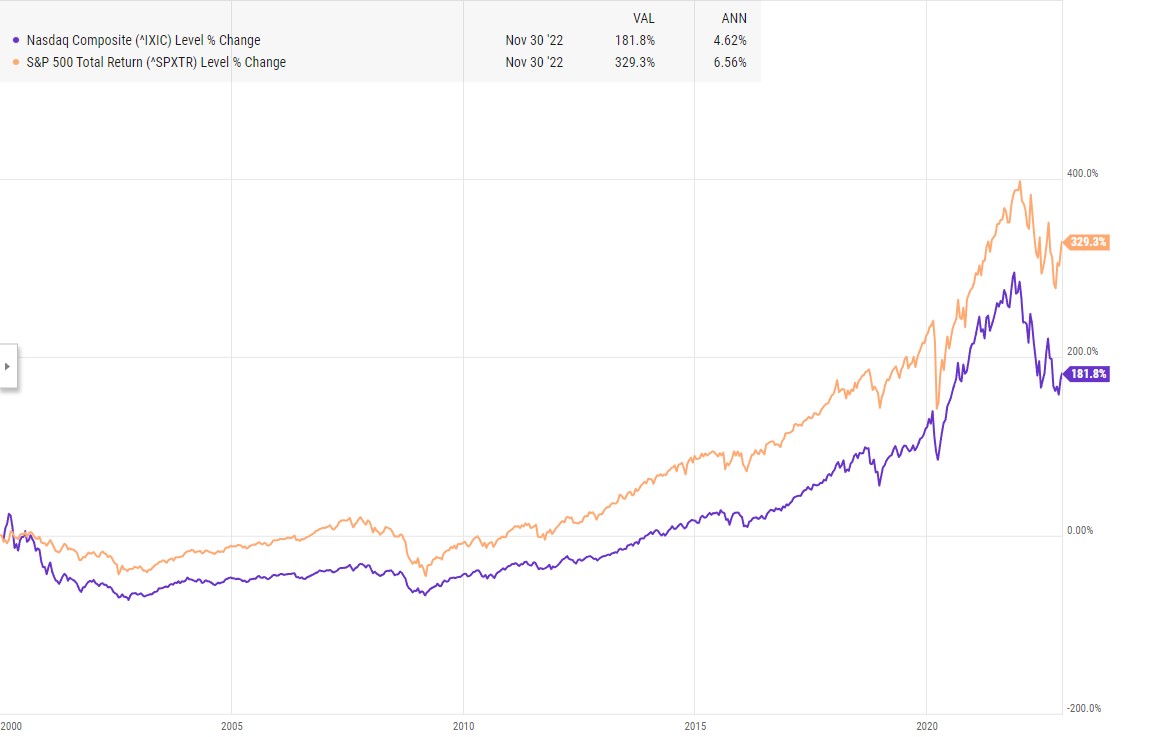
Here’s an interesting chart that shows that since January 1, 2000, through November 30, 2022, the Nasdaq Composite has actually underperformed the SP 500 by about 200 basis points per year. If the starting data is changed to January 1, 2010, the Nasdaq Composite is ahead of the SP 500 by about 50 bp’s a year, on average. (Chart source: YCharts):
Given the negative sentiment headed into 2023 around the US stock markets, I wouldn’t be surprised to see a +15% return for the SP 500 in 2023, possibly a lot of it back-end loaded. Wage inflation could be an issue as consumer prices start to moderate. Crude oil and gasoline are falling quickly, but grocery inflation continues to be an issue. After reading the Kroger conference call summary, Kroger management did say that that they expected grocery inflation to moderate in 2023, down to 2.5% – 3%, but it didn’t read like it was said with a lot of conviction. Kroger did say that in 4th quarter of 2021, inflation rose to 4% and that the inflation compares might get easier as 2023 unfolds.
Last week’s “average hourly earnings” increase got a lot of attention, but it’s interesting that long-dated Treasuries couldn’t hold their losses on the day and the 10-year Treasury finished the day at a smaller loss and is trading at a lower yield this week (3.46%) than it closed last Friday, December 2nd (3.50%).
Next week is CPI data and then the FOMC announcement.
Summary / conclusion: Unfortunately the next few weeks and through January ’23 will see readers and investors inundated with stock, bond and economic forecasts, and readers should take all of it with considerable skepticism. It’s impossible to predict – it really is – and while last year at this time this blog made some reasonably-accurate assumptions about 2022 (here and here) the one event that was quite unexpected was the invasion of Ukraine by Russia, and what that did to continental Europe and the dollar and energy prices.
While the Fed was 90% of the story for this year, the disruption caused by Ukraine was significant. That threw a wrench into everything, but it’s now approaching a year later and the avalanche of negatives is fading, particularly for Non-US and international investing.
A year ago, every client meeting was left with “2022 is going to be a tougher year” but I do think (and this is just one opinion) that 2023 will be an easier year to get a reasonable return on equities and bonds, and really in no way, do I think 2022 was the start of a secular bear market.
That’s one opinion and take it for what it’s worth. 2022 went a long way towards removing a lot of bullish sentiment, and made the various fixed-income asset classes attractive again from a yield and total-return perspective.
Thanks for reading.