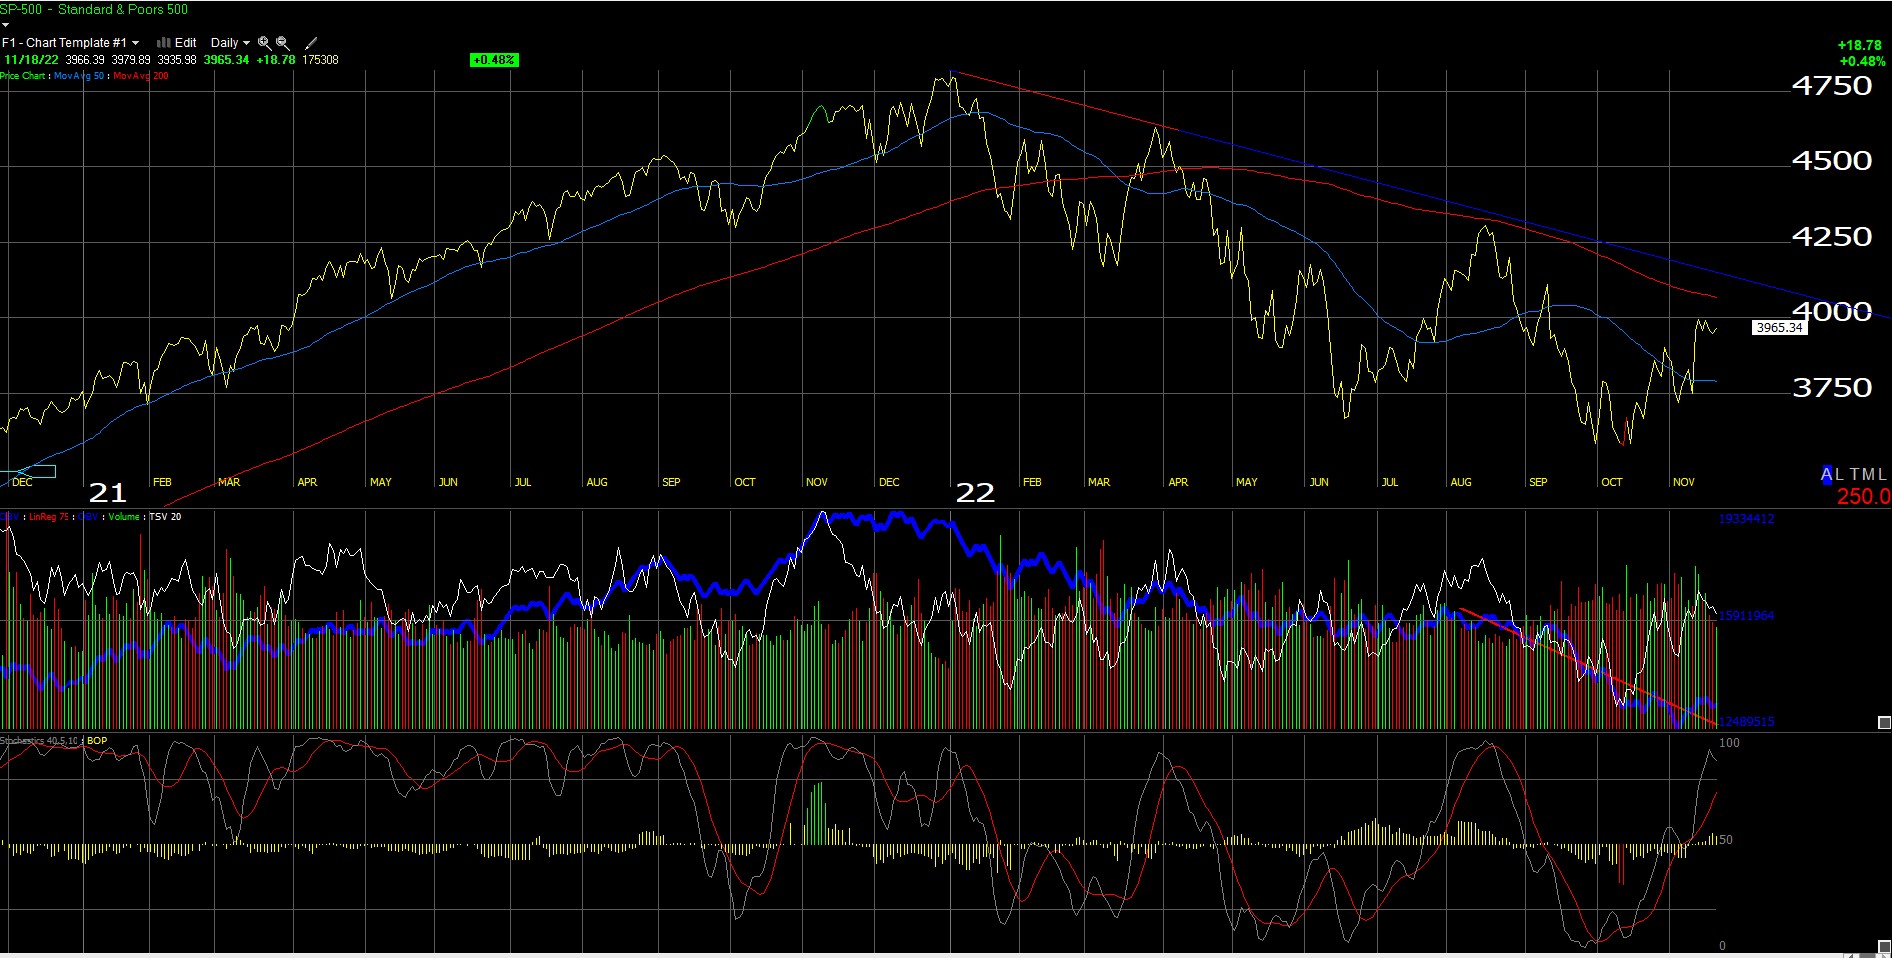
This chart of the daily SP 500 over the last 12 months tells us nothing has changed and nothing will change, until the SP 500 can trade above it’s 200-day moving average – the point of the August ’22 rejection – and then remain above the 200-day.
Here’s the key levels that were jotted down last week to keep an eye on:
- 4,067.38 – 200-day moving average for SP 500;
- 4,325.28 – August 16 ’22 high (which at that time coincided with 200-day m/a);
- 4,637.30 – March 29 ’22 high (the rally after the first fed funds hike in March ’22)
- 4,818.12 – 1/4/22 high or the SP 500’s high tick for 2022 so far;
The SP 500 closed Friday, 11/18/22, at 3,965.34.
There is a long way to go to repair this technical damage.
The financial media keeps talking about the 4,100 level for the SP 500 as the first break-point (so to speak) which makes sense. The downward-sloping trendline is above the current 200-day moving average, and that represents a technical resistance level too.
However, the good news is the economic and market fundamentals are starting to improve:
- The improvement in the October CPI and PPI are a good first sign. More importantly, the labor market is weakening gradually, which is a plus. Average hourly earnings within the October nonfarm payroll report was weaker-than-expected.
- Readers and investors get another jobs report (November ’22) on December 2nd and another CPI report (November ’22) before the next FOMC announcement. The November CPI report will come out on day prior to the next FOMC announcement on Wednesday, December 14th, 2022.
- The high-yield credit (i.e. junk bond market) has not made a new low since the June ’22, even though the SP 500 traded below the June ’22 lows in late September and October ’22.
The corporate high-yield credit market is often an early-warning indicator of both economic trouble and stock market weakness, thus the fact that it’s remaining somewhat well bid is a good sign. I’d like to see it move higher (in price, lower in yield), and with that improvement, see the SP 500 trade above the 4,100 level and the 200-day moving average. Watch how the SP 500 and the high-yield credit market trade together: if high-yield credit starts to deteriorate, it likely doesn’t bode well for the SP 500.
The Energy sector:
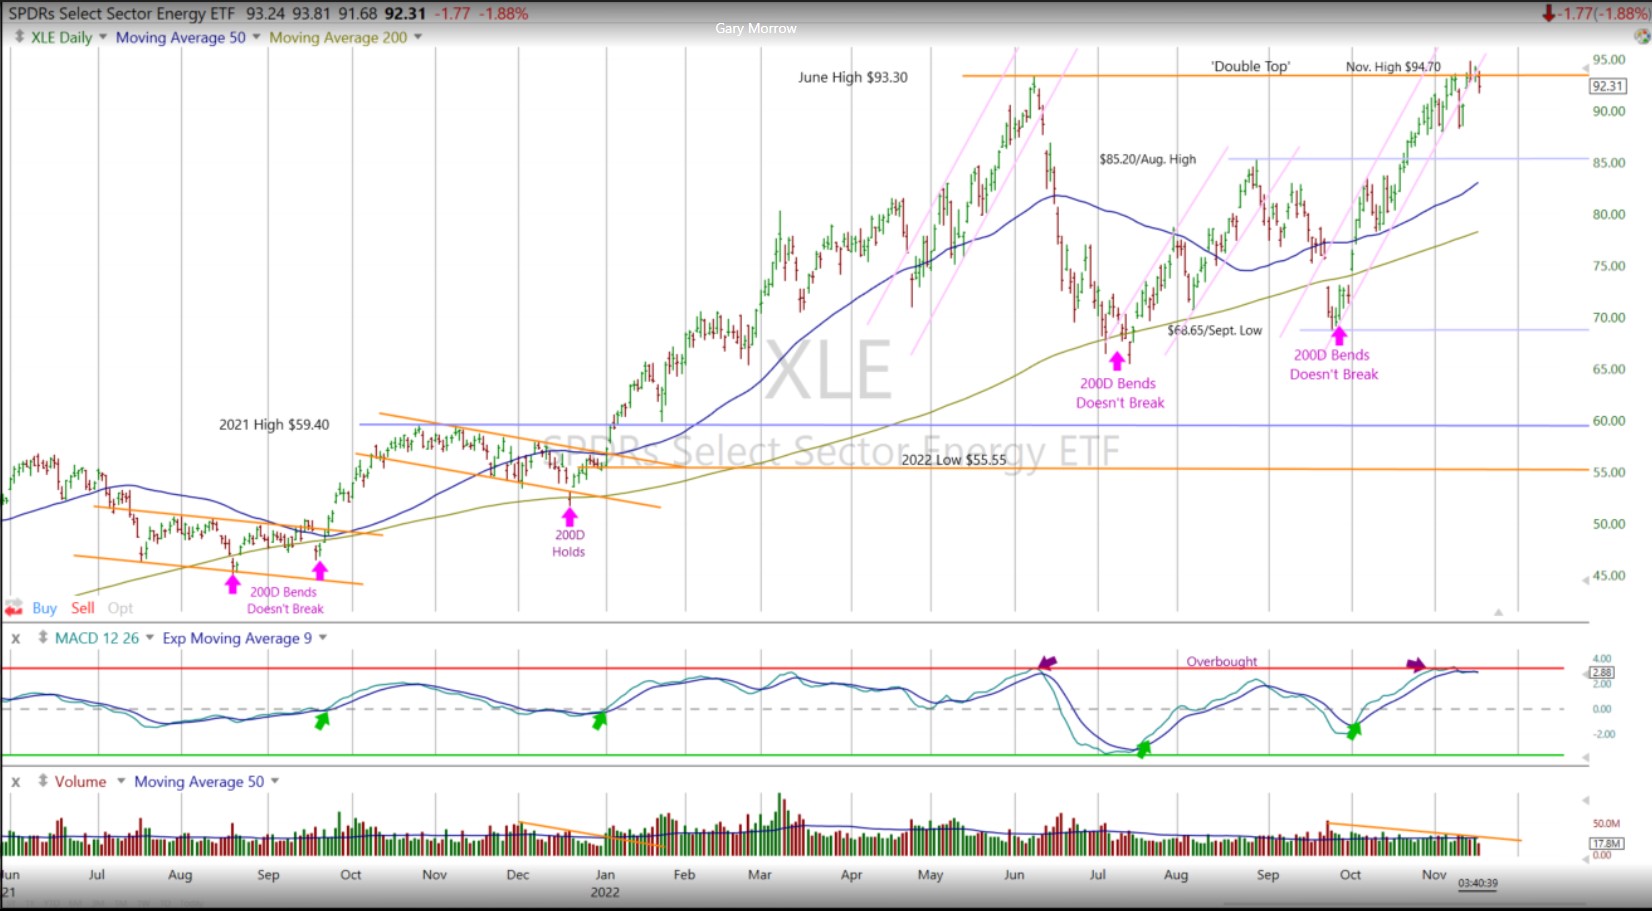
This chart should have been posted mid-week last week from one of my favorite technicians Gary S Morrow (@GarySMorrow) who pointed out the double-top in the XLE.
An update on Energy sector “compares” from 2021 and 2022:
Sector EPS growth (y.y):
- Q3 ’22 est EPS gro: +140.8%
- Q2 ’22 EPS actual: +295%
- Q1 ’22 EPS actual: +269%
- Q4 ’21: 12,611% (no typo)
- Q3 ’21: +1,798%
- Q2 ’21: +243%
- Q1 ’21: +28%
Revenue Growth (y.y):
- Q3 ’22 est rev gro: +48.4% (est)
- Q2 ’22: +77%
- Q1 ’22: +59.5%
- Q4 ’21: 91%
- Q3 ’21: +75%
- Q2 ’21: +243%
- Q1 ’21: +28%
- IBES data by Refinitiv
Maybe more interesting – looking at 2019 – Energy had negative y.y EPS growth in all 4 quarters in 2019, and negative y.y revenue growth in 3 of the 4 quarters in ’19.
The point of all this data is that Energy faces tougher compares in 2023. That doesn’t mean that’s bad it’s just y.y growth – while still strong – may not look as robust given the “shoot-the-lights-out” 2022.
On the flip side, Refinitiv data shows that Energy is expecting 15.6% revenue growth in Q4 ’22 (per the 11/18/22 reports), while EPS growth for the sector is expected at 71%, which is still seeing higher revisions.
Readers and investors can make up your own mind, but the sentiment around the sector is very bullish, against tough compares, and at least the potential for a recession.
For me the energy sector represents the proverbial “crowded trade”. So did tech too earlier this year, but evaluate the sentiment around tech today versus 10 months ago.
Summary / conclusion: In 2007 and 2008, even long before Lehman, corporate high yield credit spreads were widening, and I can’t recall what they did around the Bear Stearns rescue in May of 2008, but I would imagine high yield credit spreads at first rallied and then widened back out. Unfortunately, the HYG and JNK high-yield ETF’s weren’t launched until 2007 and 2008, thus the charts head straight south during those time periods from their initial trading levels.
The point being that – the fact that high yield credit is acting well today – could portend favorably for stocks despite the excessive negative sentiment from the doom-and-doom crowd.
Reading more negative articles this weekend from Roubini, or Michael Burry, the bearish case is understandable, but many of the prognosticators are looking for a 2008-type scenario for stocks, which would assume a 50% decline. (Maybe they haven’t looked at this chart yet.)
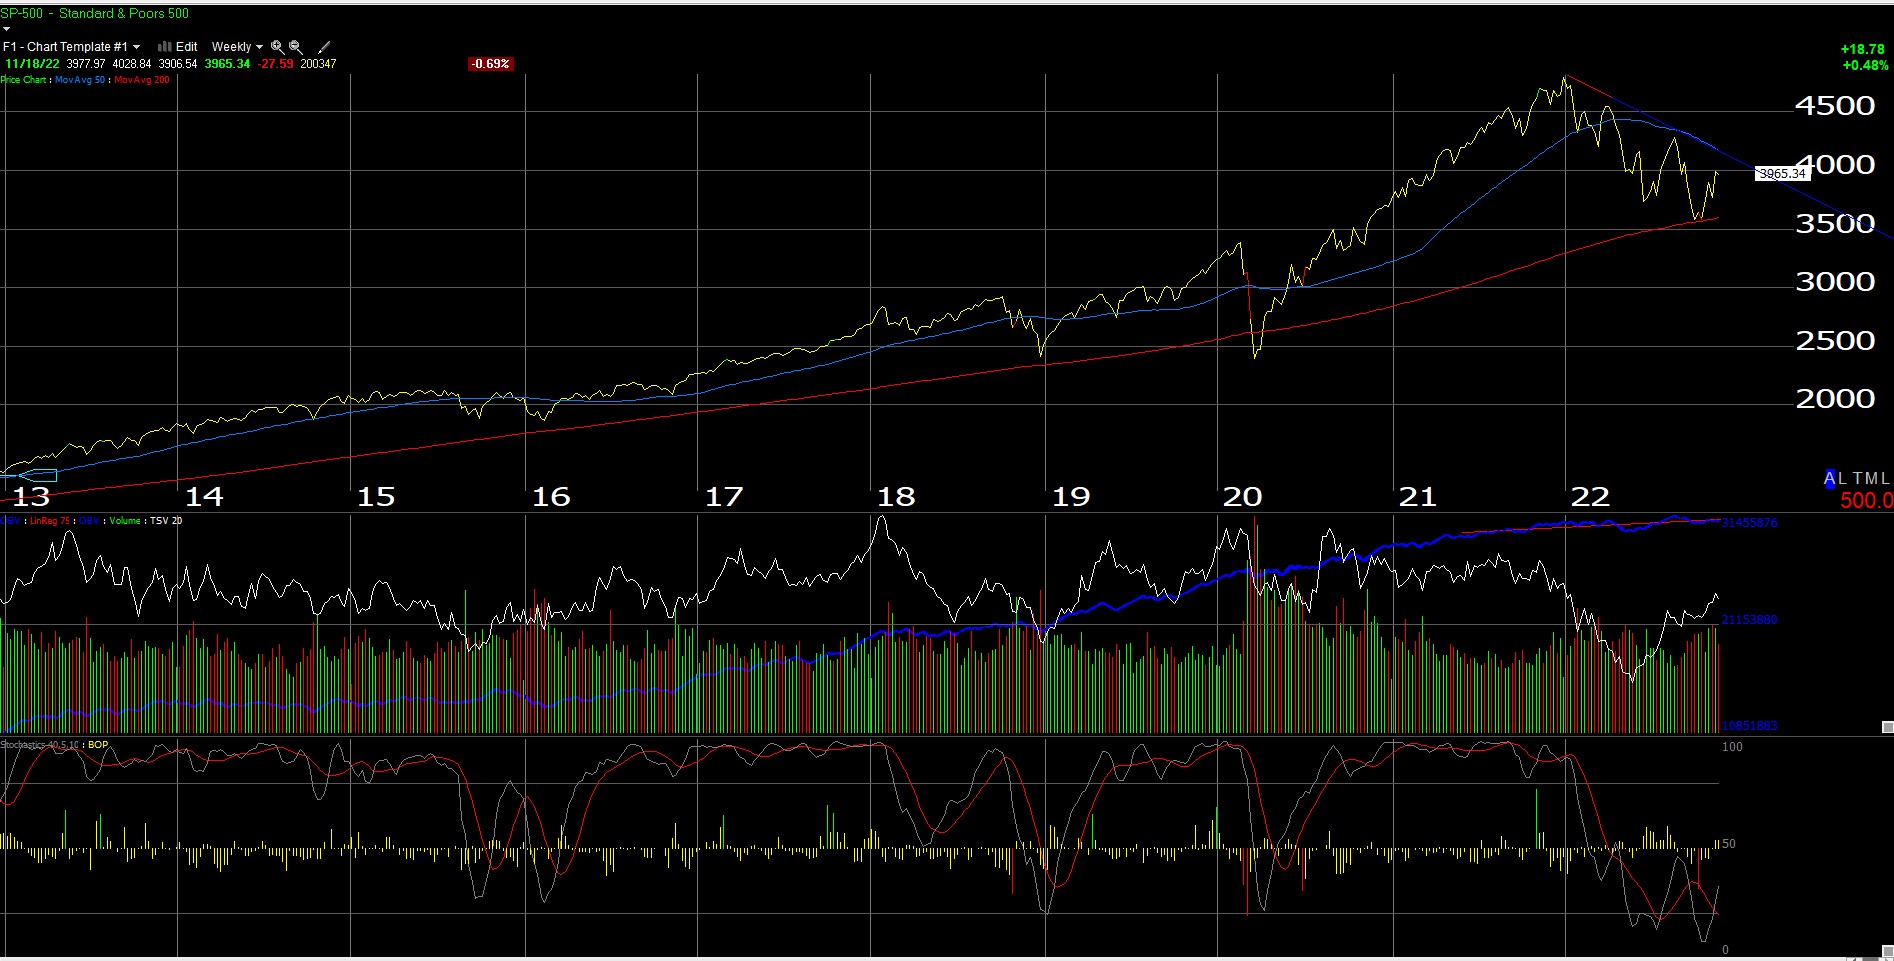
This chart tells me the SP 500 has not yet broken completely.
For me the seminal moment in early October 2008, after the Lehman crash, was when Treasury Secretary Henry Paulson announced that all funds in any money-market accounts as of the previous night’s close would be supported dollar-for-dollar because of the mounting concern around the Reserve Fund breaking the buck. (Although I’m working off memory of events from 14 years ago, the Reserve Fund was a very large money-market fund in existence at that time that was loaded with short-term mortgage paper, since the sponsor that offered it wanted to have an attractive money-market yield and I believe the Reserve Fund attracted other money-market funds as depositors. The point being that if the Reserve Fund “broke-the-dollar” it could have been disastrous for the financial system.) The Treasury Secretary couldn’t support forward additions to money-market funds since it may have triggered an additional wave of stock and bond liquidations, which would only exacerbate the market stress being seen in early October, 2008.
Even with liquidity issues in Treasuries and stress on commercial bank deposits today, (will be covered in another blog post) I just have to think today’s concerns pale in comparison to the complete meltdown in real-estate wealth that was seen from 2006 to 2009, that was – at that time – in the process of domino’ing across the US and global financial system) which also represented at a far greater percentage of household wealth than the US stock market.
That’s one opinion. I also cannot state unequivocally that a 2008-type 50% stock market correction won’t happen again for entirely different reasons.
However the high-yield credit markets are – so far – telling us otherwise. To me, the corporate junk bond market does not look stressed.
Take all this with substantial skepticism, and healthy grain of salt. All opinions are my own, past performance is no guarantee of future results and none of this information may be updated in the future. Writing every weekend and sometimes during the week, forces me to organize the thought process, and hone in on what’s critical. Frankly, the corporate high-yield or junk bond market can be a critical “early-warning” system for the stock markets.
Thanks for reading.