The SP 500 EPS revisions look grim. Here’s the data:
- The forward 4-quarter estimate (FFQE) fell to $226.72 from last week’s $229.54 for a sequential decline of -1.23% only slightly better than last week’s sequential decline of -1.32%.
- The PE ratio this week ended at 16.6x versus last week’s 17x print;
- The SP 500 earnings yield ended the week at 6.01% vs last week’s 5.88%;
- The Q3 ’22 bottom-up EPS estimate finally made it above $55 per share, ending the week at $55.97;
Here’s the “rate-of-change” data for the forward EPS curve:
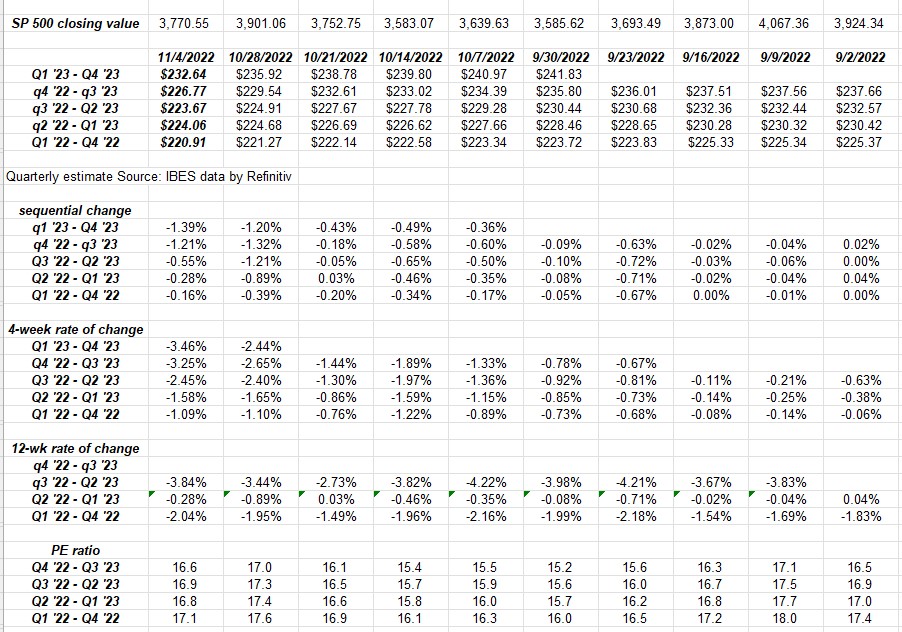
The sequential negative revisions eased up a little while the 4-week negative rate-of-change accelerated as it moves lower.
Looking at expected sector growth rates for 2022 and 2023:
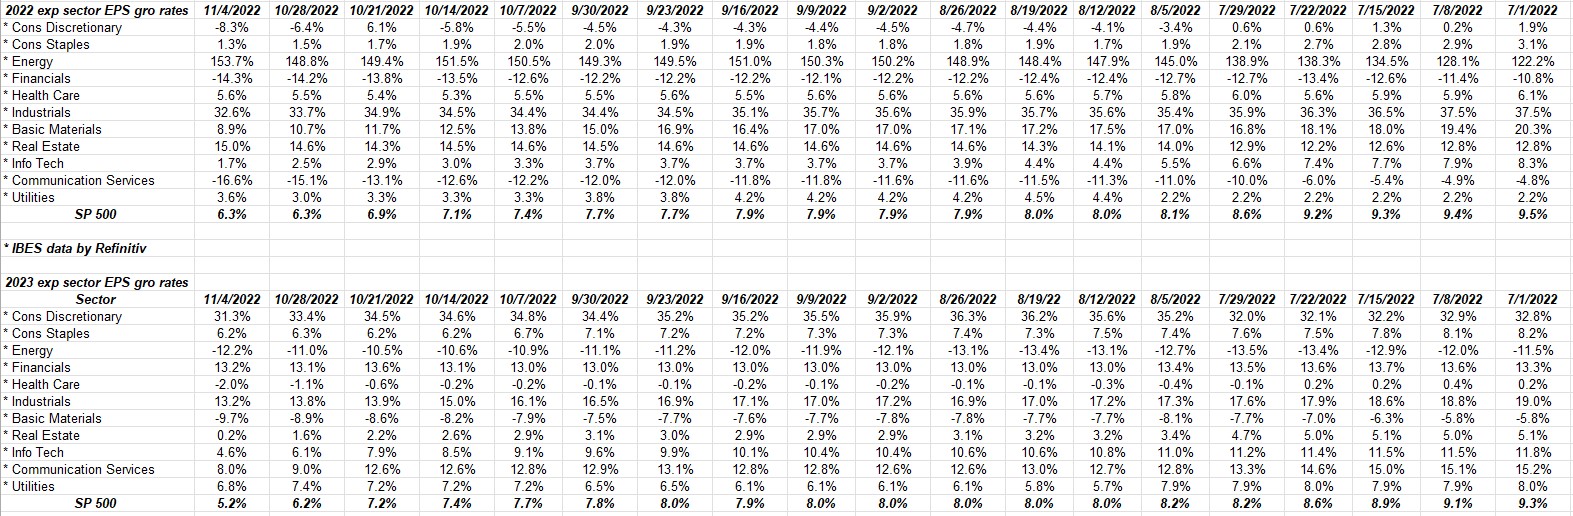
2023’s expected SP 500 growth rate of 5.2% was 9.3% on July 1 so 2023’s expected EPS has already been cut almost in half.
2022’s expected SP 500 EPS growth rate was 9.5% and is now 6.3% thus 2022’s full-year EPS growth rate has been reduced by 1/3rd.
You can see the pressure is really on 2023 EPS.
Summary / conclusion: There is always a difference between the stock price action and the data. The real weakness has been in the mega-cap names, particularly and surprisingly Apple since Q3 ’22 earnings (or Apple’s fiscal Q4).
Let’s ask a hypothetical question: if you had no other research to look at every week, and just looked at SP 500 earnings estimates, would it make sense for the SP 500 to be down -19.85% as of Thursday night’s close on just this trend in SP 500 earnings since the summer ?
You’d likely say “probably not” and in fact you’d be right, since most of the SP 500 action has been “PE compression” this year thanks to Treasury yields.
Ed Yardeni came about 6 weeks ago and said he thought that SP 500 EPS for full-year 2022 would be around $215 per share. As of tonight, the Refinitiv estimate is $220.91, which is down from $223.72 on 9/30/22 and $228.86 on July 1 ’22.
The PE though – at least for the forward estimate – bottomed in mid-October ’22 near 15.4x and is up to 16.6x as of tonight, 11/4/22.
It’s navel gazing for sure, but we are actually starting to see a little PE expansion in the SP 500 again.
And it could be nothing too.
Take all this with a grain of salt. Past performance is no guarantee of future results and none of this content might be updated. The trend in 2023’s SP 500 EPS is negative meaning expected 2023 EPS growth has fallen from 8% 10 weeks ago to 5% today. Not 2008-like drops, but still worth noting. When SP 500 earnings revisions and trends are like this, the market trades like it has a piano on it’s back.
October CPI inflation data gets released this Thursday, November 10th. It’s still all that matters. If the 10-year Treasury yield trades above the 10/21/22 high of 4.33%, then there is probably more downside ahead for the SP 500.
Thanks for reading.