After last week, the 2022 YTD return on the 60% / 40% benchmark portfolio is -12.78%, improved from the previous week’s -14.41 and improved from the week of June 17th’s -17.98%.
The improvement in the 60% / 40% return, came entirely from the gain in the SP 500 last week, as the AGG TYD return actually fell 51 bp’s on the week.
Having managed client money for so long, and having experienced the constant free-flow of opinions that – whatever the market conditions – it’s still surprising to me to see the vast differences of opinion on what’s going to happen to stock (and bond) markets in the next few weeks and months.
You can make a very good case for the SP 500 continuing to rally into year-end, and you can make the case that – like Scott Minerd did on CNBC this week with his “market will correct 20%” – that risk of a significant drawdown in the SP 500 is still in front of us.
You have to respect the bear scenario and here’s what it seems to entail:
- QT or quantitative tightening: shrinking the Fed’s balance sheet and the continued significant liquidity removal from the financial system will negatively impact stocks and bonds;
- Recession risk looms large as the US economy slows;
- SP 500 earnings are at risk thanks to #2;
- Europe will suffer or incur a serious recession in late 2022 and early 2023 thanks to the energy shock that Russian natural gas supply will catalyze;
- With Technology’s weight in the SP 500 as 27% % of the market cap of the SP 500, a sharp deterioration in the mega-cap (top 10 names) in the SP 500, would cause a problem for the market, but not necessarily for the economy. Technology stocks are not growing as fast as they were in late 2020 and 2021. Apple and Microsoft alone remain almost 13% of the SP 500 index by market cap as of 9/9/22.
Whether you agree with the above bullet points or not, you have to respect the above potential catalysts for further market downside.
What I vehemently disagree with is the 2008 analogies: the near collapse of the US banking system and a complete lockdown of the US credit markets, to the point that – near the bottom in Q1, 2009, the high-yield credit market was yielding 25% – seem genuinely ludicrous.
The high yield market actually performed pretty well last week, with the HYG (high yield ETF) +178 bp’s on the week.
Another interest data point: Europe was up 4% last week, despite the OPEC production reduction and the NordStream1 news.
SP 500 earnings:
- The forward 4-quarter estimate (FFQE) for the SP 500 fell 12 cents last week to $232.45 from the previous week’s $232.55;
- The PE ratio is 17.5x as of the weekly close, versus 19.9x on April 1 ’22 and 21x as of January 1 ’22;
- The SP 500 earnings yield was 5.72% as of Friday, versus the 5.93% last week, and the 5% on April 1;
- With Technology’s weight in the SP 500 as 27% % of the market cap of the SP 500, a sharp deterioration in the mega-cap (top 10 names) in the SP 500, would cause a problem for the market, but not necessarily for the economy. Technology stocks are not growing as they were in late 2020 and 2021;
Credit Suisse last week put out a note on the decay in the expected Q3 ’22 bottom-up estimate for the SP 500, which is currently $56.19 and is down 5% from the 4/1/22 estimate of $59.24, versus the typical 3% erosion you’d see over the quarter prior to seeing earnings. I think this is the crux or heart of the SP 500 earnings bear case, but it’s still just 5% versus the typical 3%, so (and this is one opinion) I wouldn’t get too excited about the erosion yet, since Q2 ’22, had very tough comparisons with Q2 ’21’s y.y growth rates, and yet Q2 ’22 SP 500 earnings saw decent y.y growth and Q2 ’22 was generally thought to be a very solid quarter of results.
Maybe a little more interesting to data geeks like myself, the current 2023 calendar year estimate of $243.59 is down only 2.5% from it’s 4/1/22 SP 500 EPS estimate of $249.88.
For one final point, in the 11 weeks of the quarter starting July 1, ’22 the SP 500 FFQE, has declined sequentially for 10 of those 11 weeks, which used to be the pattern pre-Covid. As was detailed in this blog post, SP 500 earnings are returning to pre-Covid patterns, which is a good sign.
Whatever the stock market’s issues are, as of today, SP 500 aggregate earnings estimates are not one of them (at least not yet).
Inflation data this week:
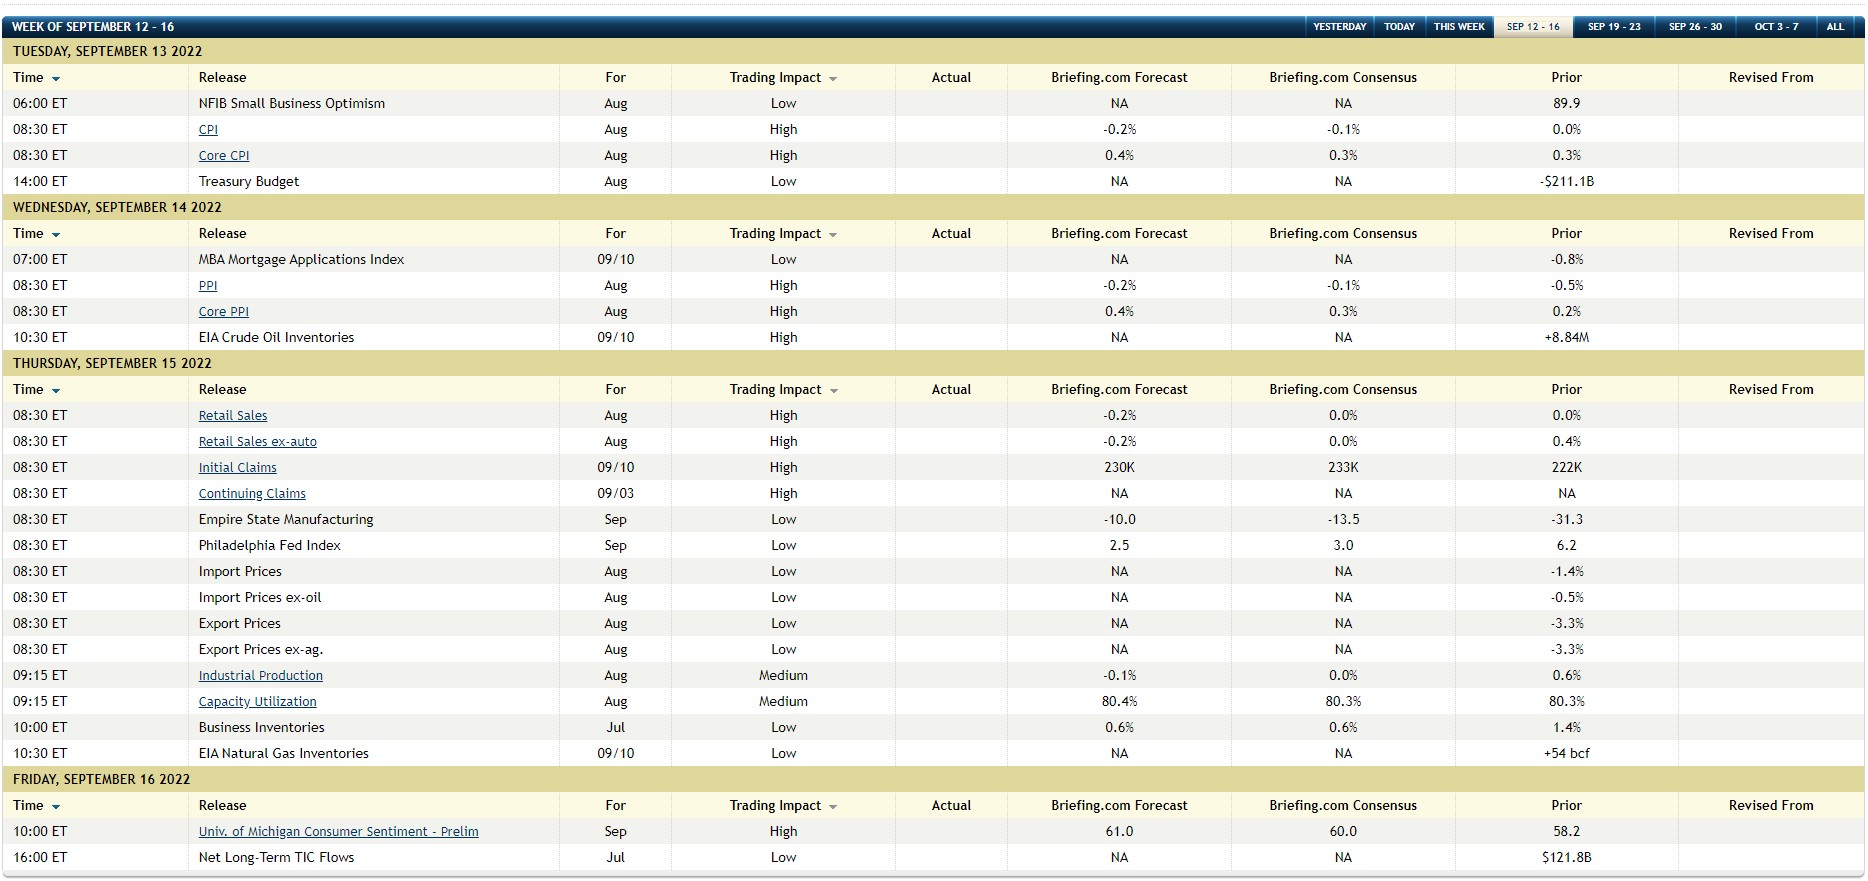
The above table is Briefing.com’s schedule of economic data to be released this week, with consensus estimates.
While all the attention will be focused on the August CPI and August PPI, both of which are expected to show slowing inflation rates (disinflation), Thursday’s jobless claims and Retail sales data aren’t to be ignored either.
It’s the labor data that’s throwing a wrench into the “soft landing” thesis being posited by Powell and the FOMC. The positive news is that average hourly earnings (AHE) data softened with the August jobs report.
Earnings Reports:
Software has struggled this year (along with everything else) as higher-multiple growth stocks are not the kind of stocks that get rewarded in this type of market environment. Oracle (ORCL) reports after the close on Monday, September 12th per Briefing.com, while Adobe (ADBE) reports Thursday night, after the close. While both of these stocks are considered “older tech” Adobe is expecting a little better EPS growth, versus Oracle’s low single-digit expected growth in EPS.
Summary / conclusion: Something has to give between the bull and bear case for the stock market, and it’s probably the bond market. Most institutional investors seem to think real QT or quantitative tightening will catalyze another sharp leg lower in the SP 500. The expectations around the August CPI and August PPI data is pretty optimistic in that investors will see improved numbers and the underlying data support all that. Broken down by components, even used-car values have rolled over in terms of y.y price increases and are starting to disinflate.
It’s almost a given that the FOMC and Jay Powell will raise the fed funds rate by 75 bp’s on September 21, so none of this may matter.
I’ll continue to say again: I do think the 2008 analogies are ludicrous. The real risk is “Do we retest the mid-June ’22 lows for the SP 500 of 3,636.87 ?” Credit spreads have remained contained, which if you survived 2007 – 2009 as I did, was an early tell and and an early warning to what was happening in the stock market.
Watch high-yield spreads. It would be highly unlikely that high-yield credit spreads would rally substantially if there was a valid worry about the stock market.
Take all this with with a healthy truckload of salt and substantial skepticism. It’s one opinion and past performance is no guarantee of future results. Capital markets change quickly and can go from bad to worse even quicker. You’ll have plenty of time to get invested if the markets do rally from here. The constant plethora of opinions heard every day are designed to get the attention of the financial media, rather than offer any real substance to the conversation.
Thanks for reading.