The 60% / 40% balanced portfolio slid 105 basis points this week to a YTD return of -10.10%, improved from the June 17th low YTD return of -17.98%.
Readers can probably guess that the big improvement in the return came from the SP 500, while the Barclays Aggregate (AGG) YTD return has only improved 175 basis since the week ended June 17, 2022.
Per the Bloomberg data, corporate high yield has improved a whopping 432 basis points since the week ended June 17, 2022, from a YTD return of -13.10%, to this week’s close of -8.78%. Duration for high-grade corporates bonds extended to 9 years at the end of ’21, thus high-grade corporates are still returning worse than high-yield as an asset class, but “attribution” (in my opinion) is coming from duration rather than credit.
One (maybe) interesting factoid for readers: each weekend, on Saturday morning, the YTD returns are tracked for 75 – 100 ETF’s, mutual funds, and closed-end funds, across various asset classes. The TLT is one of the few ETF’s that actually had a lower YTD return as of the week ended 8/19/22, versus the week ended June 17th, 2022, -22.84%, vs. -22.63%, per Morningstar data. (More on this in the conclusion of today’s blog post.)
SP 500 data:
- The forward 4-quarter estimate (FFQE) fell again this week (sequentially) to $232.60 from $232.93, and down from the July 1 ’22 high of $241.22;
- The PE ratio on the forward estimate is 18x;
- The SP 500 earnings yield rose a little this week (thanks to the -1.13% SP 500 decline) to 5.50%, versus last week’s 5.44%, but down from July 1’s 6.31%;
- The spreadsheet below, which data is sourced from IBES data by Refinitiv, shows the trend in quarterly bottom-up estimates for 2022 through 2023, and the trend in annual SP 500 estimates for calendar years 2022 – 2024. Note how, as the Q2 ’22 SP 500 EPS estimate rises (thanks to actual earnings reports from the April to June ’22 quarter), the Q3 and Q4 ’22 SP 500 EPS estimates sink. In fact, that is the normal pattern and behavior for SP 500 EPS estimates: they tend to weaken in the quarters prior to actual results, since the sell-side consensus tends to get less bullish prior to earnings and then the street experiences the typical “upside surprise” to estimates.
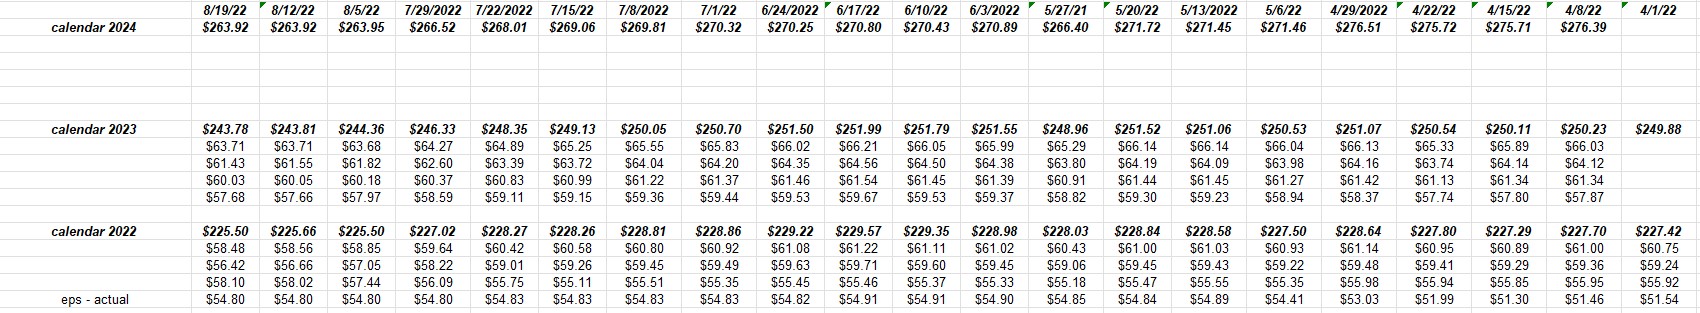
The erosion in the Q3 ’22 bottom-up quarterly estimate (per the above spreadsheet) is 5.2% since July 1 ’22, while the Q4 ’22 bottom-up estimate has declined 5% since July 1 ’22. (The above spreadsheet is dated so readers can follow the math.)
What’s interesting is that since April 8 ’22, the Q3 ’22 bottom-up estimate has been revised lower by 5% and 4.2% respectively. So cumulatively, the Q3 and Q4 ’22 SP 500 EPS estimates have seen most of their revisions lower in the last 7 weeks or since July 1 ’22.
Well that’s typical of the pre-Covid pattern, BUT that negative revision is a little steeper than historically. Typicallt that “next quarter” negative revision is 3% – 5% if my memory is any good. Jeff Miller, the highly-regarded blogger who passed away a few years ago – he and I would talk about this frequently and even Ed Yardeni has written about the typical weakness in quarterly bottom-up estimates “pre reporting” and the upside surprise will usually take the estimate above prior highs.
This was all greatly distorted with the onset of Covid and the flooding of the market with liquidity from the Fed and Congress. It was really remarkable to watch the consistently higher revisions to SP 500 EPS estimates during the Covid quarters. Q3 ’20’s SP 500 EPS estimate started at $32, and “actual” EPS was $38.69. Upside surprises in the next few quarters, will be nothing like we’ve seen in the last 8 quarters.
Here’s another visual way to get the point across to readers:
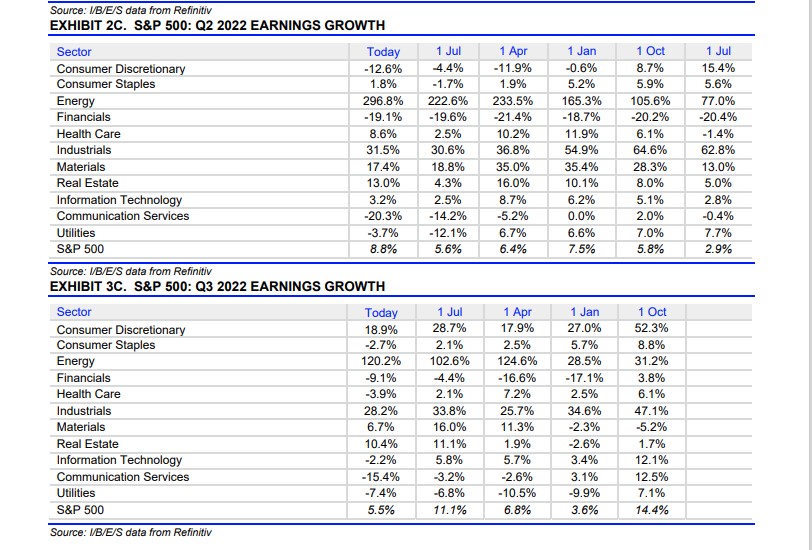
Both of these tables are from Refinitiv’s This Week in Earnings: note how the 2nd quarter of 2022’s EPS growth has improved by 320 bp’s or 3.2% since Q2 ’22 earnings season began. For readers that 3.2% constitutes an “upside surprise” factor, which is a return to a more normal operating environment than what we’ve seen in the last 8 quarters.
Also note how Q3 ’22’s expected SP 500 EPS growth rate has been revised lower from 11.2% to 5.5%, which again is (in my opinion) a sharper than normal negative revision to expected EPS growth, but some of that could be the environment today, and a continued lack of any confidence in the sell-side consensus raising estimates.
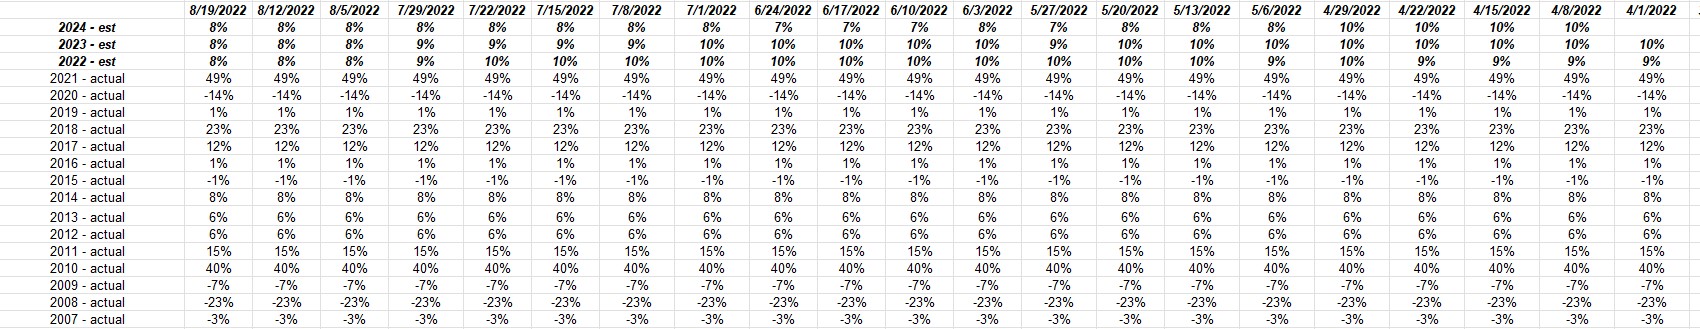
To show one last table, the “expected” annual SP 500 EPS growth rates for 2022 through 2024 is – as of this last weekend’s data – about 8% per year. That’s down from an expected 9% as of April ’22.
The table shows the last decade’s actual SP 500 EPS growth rates and how long it took for the SP 500 EPS to normalize after 2008 and all the changes in regulation, particularly within the US banking system.
SP 500 earnings and the US corporations therein are returning to a more normal operating environment at least through the end of 2022 (and this assumes no exogenous shocks appear) and it’s giving both bulls and bears (but particularly the bears) plenty of fodder for being very negative.
Summary / conclusion: The Jackson Hole Symposium this week, will start on Thursday, August 25th, 2022, and although it will garner all the media attention, there is also some critical economic data coming out later this week, and particularly Thursday and Friday mornings, that could move the needle more than Jay Powell’s commentary:
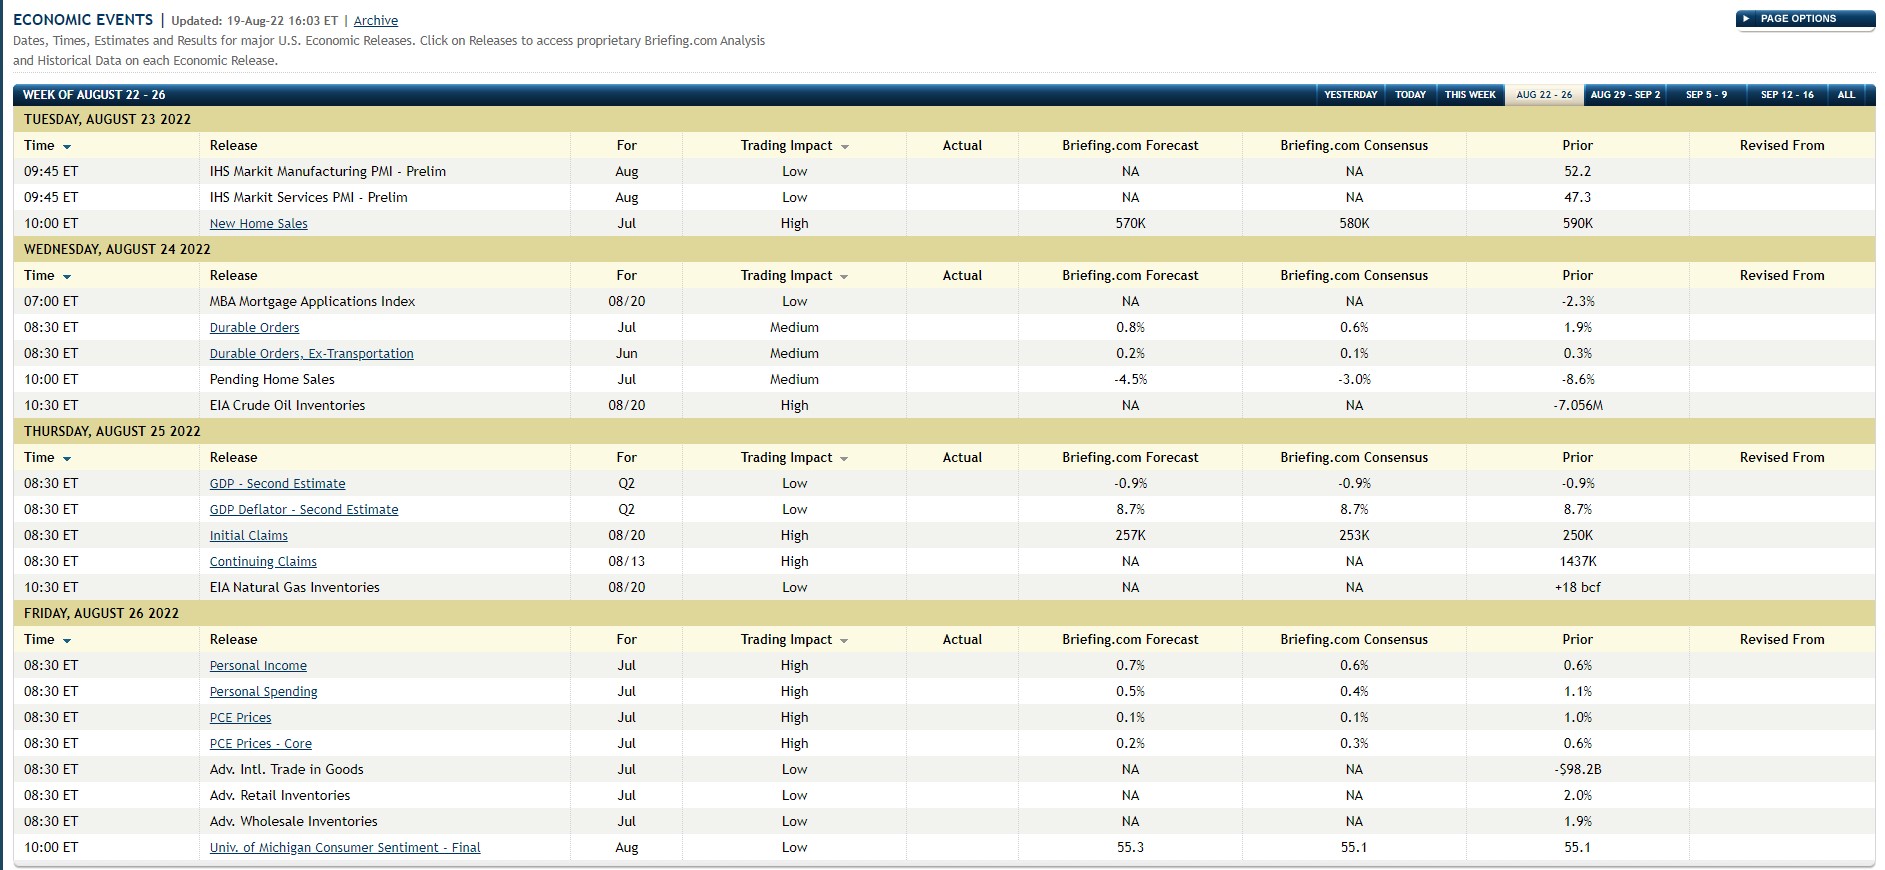
Watch Thursday’s GDP deflator, which is a Fed favorite and then Friday morning we get PCE and Core PCE prices.
As one opinion – and take this all with substantial skepticism – there is likely zero chance that Jay Powell softens his hawkish commentary, but the market could react more to the economic data and effectively ignore the Jackson Hole rhetoric.
That’s a big leap though.
Today’s blog post was more nuanced and more “threading-the-needle” in terms of detail because I truly believe the shock of Covid and how it grossly distorted SP 500 revenue and earnings (and the US economy) is something all investors are still living with, but the “normalization” of SP 500 EPS and its expected growth rates could also be resulting in many being more bearish than they should be or need to be.
In terms of the stock and bond markets and what they might look like, (and again this is one opinion, take it with substantial skepticism, understand the opinion can change quickly with this week’s data and past performance is no guarantee of future results), I do believe the mid-June lows for the SP 500 were a hard bottom, but it might take several months or longer for the SP 500 to make a new all-time-high and the SP 500 could simply be range-bound, well into the November – December ’22 period.
While I believe good and services inflation will continue to decline over the next few months (and thus Friday’s core PCE and PCE data could be positive for bond investors), wage inflation is going to be a thorny issue for the Fed. The July ’22 jobs report and average-hourly earnings may be stickier than the Fed wants. This might results in the Fed moving slower and smaller on fed funds rate hikes, but still raising rates nonetheless.
Opinions are easy, but remember to be prepared to change up quickly and revise your outlook when new data is released.
One thing’s for sure, it will be an interesting week. And remember, the Fed is always late.
Thanks for reading.