The forward 4-quarter estimate (FFQE) continues to decline as of the week ending August 12, ’22.
Not what you’d expect given the rally in the SP 500 from the June 17th low of 3,636.87.
SP 500 data:
- The forward 4-quarter estimate fell again this week to $232.93, down from last week’s $234.05, and down for the 7th consecutive week from the July 1 ’22 peak of $241.22.
- The SP 500 PE ratio with the 2% rise in the benchmark this week, rose to 18.14, from 17.71 last week;
- The SP 500 earnings yield fell again to 5.51% from last week’s 5.65%, and the July 1 peak of 6.31%;
Annual SP 500 EPS estimate changes:
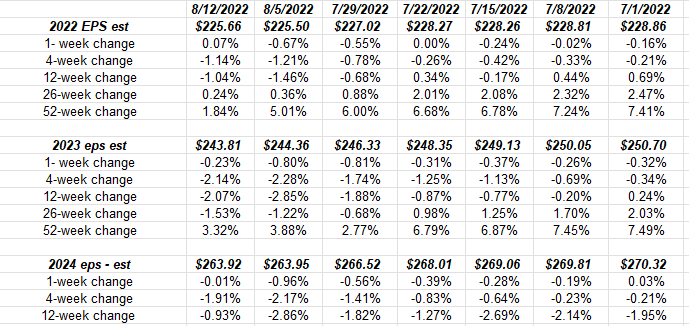
The 2023 SP 500 estimate is down 2.75% since July 1 ’22’s start, not a terrible rate of decline, but still it’s something to note.
2024’s SP 500 EPS estimate is also is also down $7 from July 1’s start, but it’s a smaller percentage change.
Current quarter’s EPS and revenue growth rates seeing higher revisions:
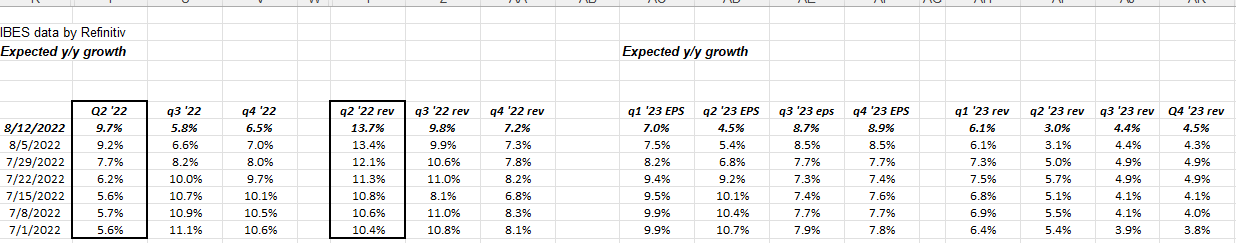
If you look at this table, it shows you why Wall Street commentary is so much hot air. The Q2 ’22 EPS and revenue results are pretty good (shaded areas) and seeing higher revisions to growth rates since the quarter started July 1, but analysts who were bearish this quarter’s results, are now saying “wait till next quarter”, much like they said last quarter.
The expected SP 500 EPS and revenue growth rates for the rest of 2022 and 2023 are still declining.
The bullish angle:
The fact is market internals and the fact that sentiment got so bad in late June, early July ’22, it was as bad as 2008, have been flashing bullish for the last 6 – 8 weeks.
Here’s a few Bespoke graphs from today’s missive:
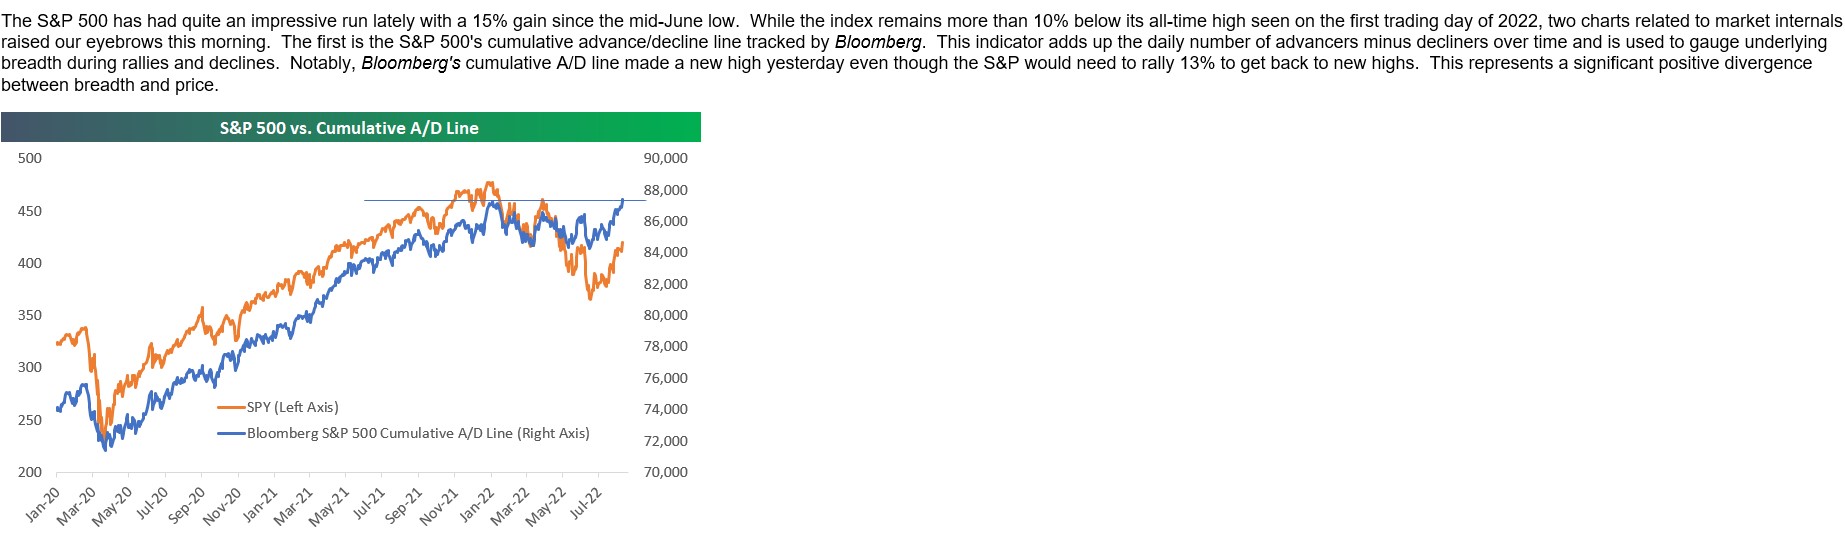
Market breadth remains a positive:
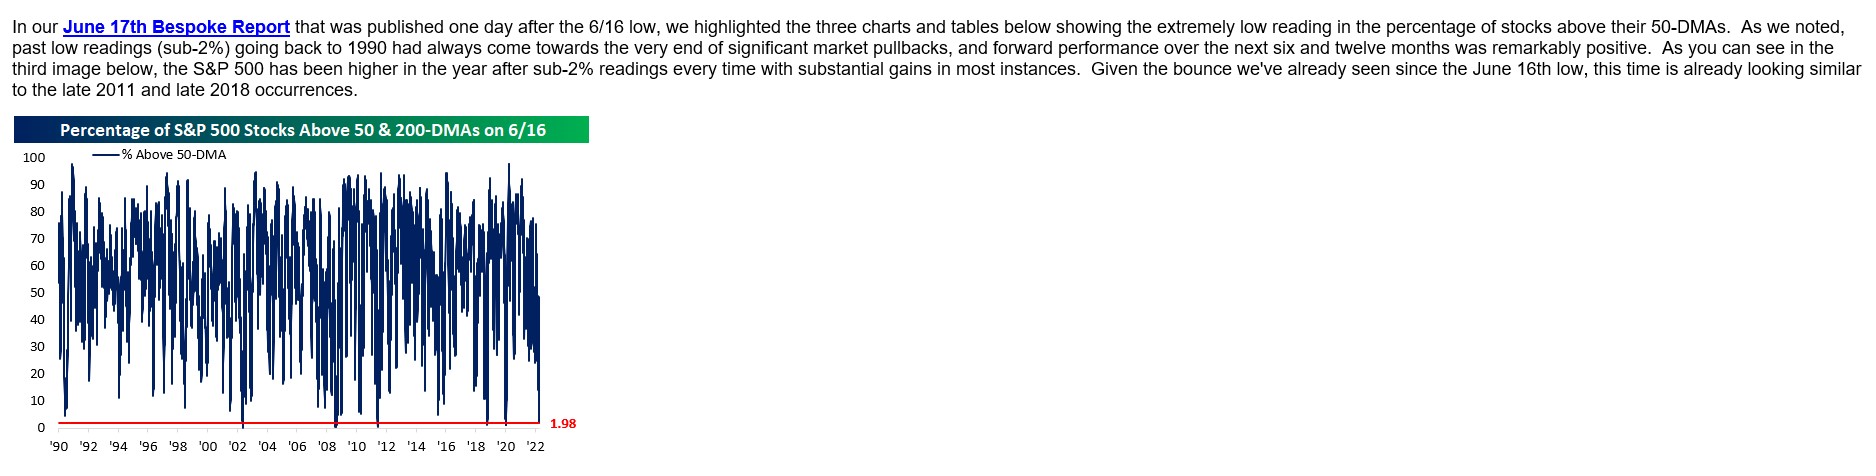
The June 16 – 17th low in the SP 500 was significant:
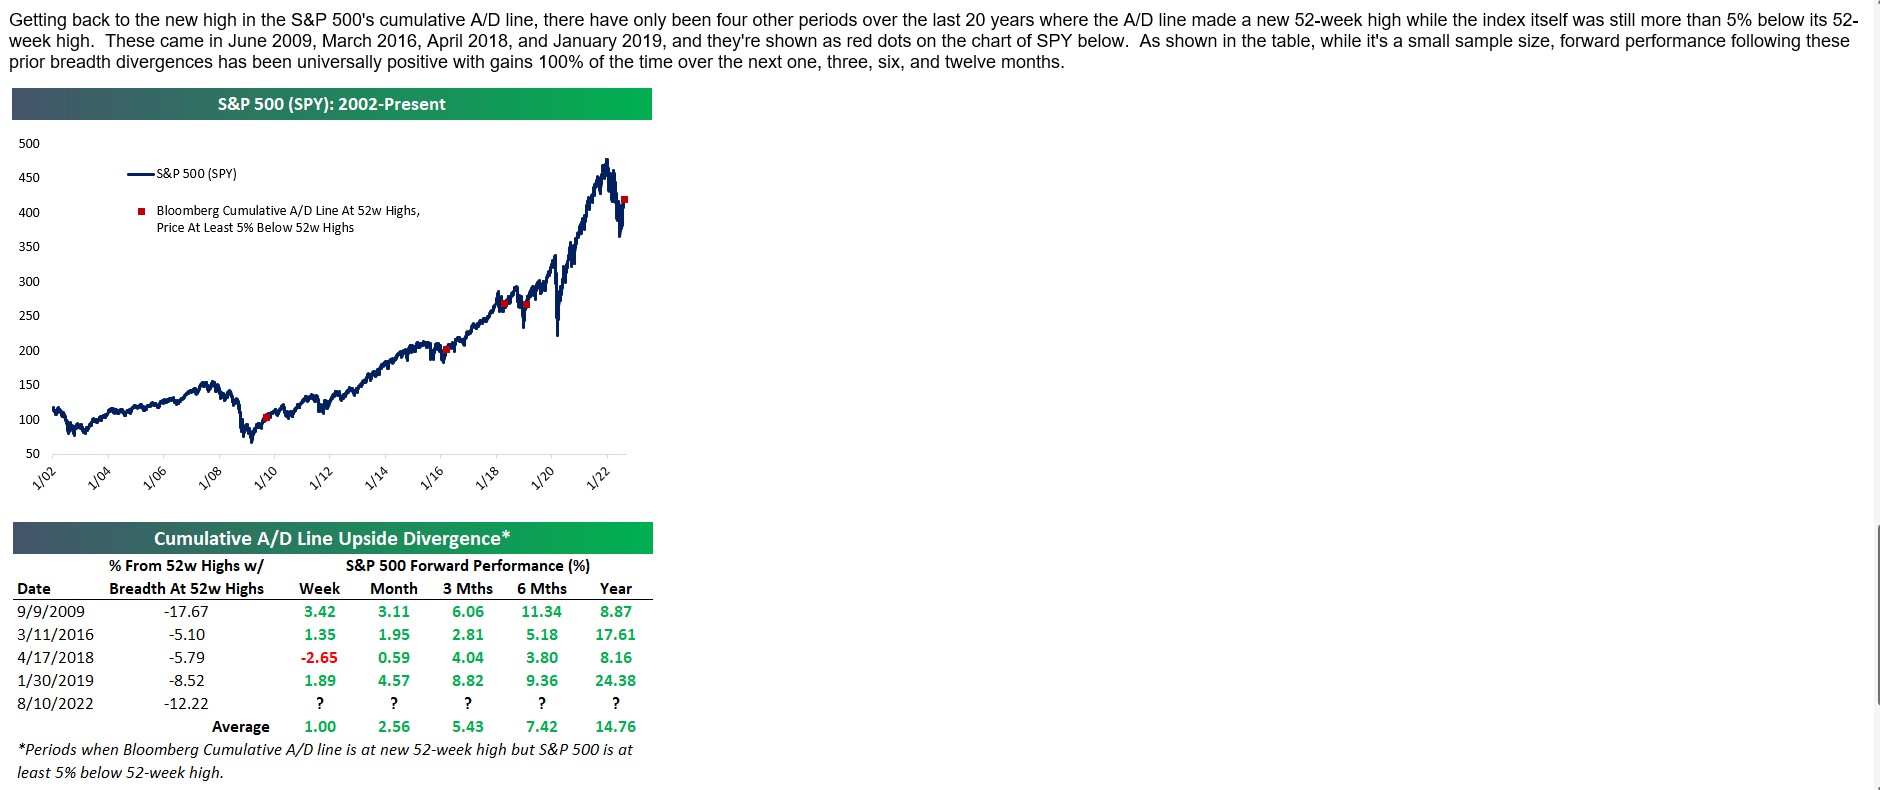
Cumulative Advance / Decline w Price 5% below prior highs:
My own two cents on the last table of Bespoke’s it still indicates we reside in a “post-2008” world, where every recession seems to trigger popular sentiment looking for a 50% correction. CNBC has trotted out a few talking heads this year who have called for 50% declines in the SP 500, even though that severe of a decline only occurred once between 1945 and 1999, (and that was 1972 – 1973) in the post WW II bull market. Investors saw two 50% declines in the SP 500 from 2000 to 2009, for two completely different reasons (tech valuations and housing credit) which was like getting hit by lightning twice in a day.
(Click on each of the Bespoke graphs to read Bespoke’s detail and explanation).
Summary / conclusion: No question the falling SP 500 forward estimates is more than a little worrisome, but the bullish technicals like advance / decline and the continued horrid sentiment is keeping me in the middle in terms of client portfolio construction. Not one comment on last week’s SP 500 earnings update blog post where it was noted that the June 16 – 17th lows in the SP 500, were actually accompanied by “peak” SP 500 EPS estimates and a peak Treasury yield near 3.5%. Instead, readers wanted to argue about technicals vs fundamentals.
This market and the sentiment and the CNBC / Bloomie guests remind me of the summer of 2020, (just after Covid) when everyone seemed bearish but the underlying market factors were very bullish.
The September ’22 jobs report and inflation data will be very important, and the next FOMC meeting isn’t until later in September.
Even today, with 30 minutes left in trading, all the major indices are up over 1% and high yield credit spreads are up (again). High yield credit has been flashing green, and like in late 2007 and early 2008, you don’t want to ignore credit spreads.
We get big-box retail earnings next week. Walmart and Target have internal inventory issues. The key is to watch revenue guidance.
Out for the weekend, might have a late Sunday or early Monday post.
Thanks for reading.