Both Apple and Amazon report after the market close on Thursday, July 28, 2022.
Apple (AAPL): $2.5 trillion market cap, ranked #1 in the SP 500 by market cap with a 7% weight
Apple has returned -13% YTD as of Friday July 22, ’22 versus the SP 500’s -16%.
When AAPL reports their fiscal Q3 ’22 after the market close this Thursday night, analyst consensus is expecting $1.16 in EPS on $82.6 billion in revenue for expected y.y growth of -11% for EPS, on 1% revenue growth. In June ’21 AAPL has a particularly strong compare, since the $1.30 in EPS one year ago, was against a $1.00 expectation for a 30% upside surprise, while revenue’s upside surprise was 5%. That’s a tough comp. Last June ’21 all of Apple’s businesses hit double-digit y.y growth while the iPhone was 50% y.y, and China was +58% y.y. (Those are amazing numbers from June ’21, per my s/sheet notes.)
The point is Apple could hit a home run Thursday, and the numbers might still look weak.
Typically AAPL’s big quarter’s are September and December of every year so all that’s needed is that March and June hold serve. iPhone demand surveys at the carriers still looks healthy, and per Factset, Apple’s iPhone revenue estimates for Q3 and Q4 ’22 is expected at $39 and $42.2 billion.
Estimate revisions:
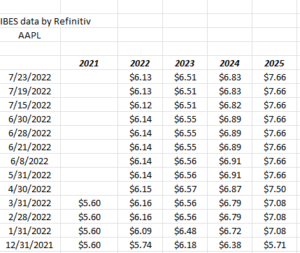 Unlike the other mega-cap tech companies, Apple’s fiscal ’22 and ’23 EPS revisions are higher by 7% and 5% respectively since 12/31/21.
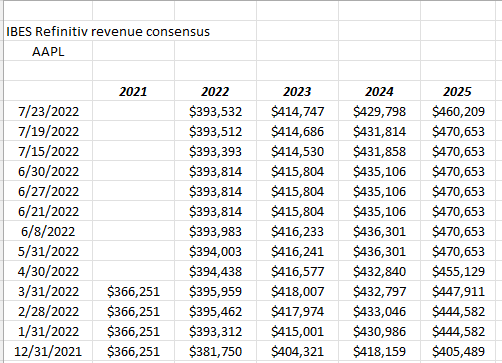
Apple’s fiscal ’22 and ’23 revenue revisions are higher by 3% and 2.5% respectively since the 12/31/21.
Summary: for year’s AAPL’s valuation always looked cheap, but today it’s trading at 25x 2022 expected EPS for what is an expected growth rate over the next 3 years for 5% – 6%. Expected revenue growth as the consensus estimates stand today are also expecting 5% – 6% revenue growth from ’22 – ’24.
Trading at a 4% free-cash-flow yield, the cash-flow valuation is 22x and 24x free-cash at $155 per share.
Morningstar values AAPL at $130 per share and maybe far more interesting has had a “narrow moat” around the stock for many, many years. My guess is that’s a function of AAPL being “tech hardware” and if you look back at what happened to “tech hardware” in 2001 and 2002, you can see why Mstar keeps the narrow moat around the brand. That being said, AAPL today is a world-class brand with the likes of Nike (NKE) and Coca-Cola (KO) so the premium valuation that has crept into the stock can also be justified.
The stock has been in an uninterrupted bull market since the point of the dot.com collapse in early 2000’s.
From a “quality of earnings” perspective, Apple is pristine, with even free-cash-flow being greater than net income:
![]()
Maybe more interesting which could be caused by the PE expansion on the stock, Apple’s buyback has shrunk as a percentage of the market cap:
![]()
Just on the positive EPS and revenue revisions alone, you can own Apple into the fiscal Q3 ’22 earnings release on Thursday night. The CFA Society of Chicago held a lunch in 2017 that featured Ariel Capital’s CIO Rupal Bhansali and she made a good case at the time that Apple was becoming a consumer staple, which as you watch people walk down the street or drive in their cars on the freeway, you quickly get that understanding.
The iPhone came out in 2009 so I think it missed the great 2008 recession, but i wonder what the consumer behavior is around an iPhone during a deeper recession. Do consumers just stay with current phones longer and delay the upgrade ? You’d think that would be the logical response.
You could make a case for AAPL having a flat year along with the other mega-cap tech stocks. We’ll see what the numbers and guidance look like Thursday for Q4 ’22 and fiscal ’23.
Amazon: (AMZN): $1.25 trillion market cap, ranked #3 in the SP 500 with a 3% weighting in the SP 500
AMZN has returned -26.5% YTD as of Friday, July 22 ’22, versus the SP 500’s -16%. ![]()
AMZN reports after the closing bell on Thursday night, with analyst consensus expecting $0.14 in EPS on $119.1 billion in revenue for expected y.y growth of -82% in EPS on 5% y.y revenue growth. Amazon hasn’t printed $0.14 in EPS since Q2 of 2018, so this is a low point for the ecommerce giant, but overbuilding on capex, and supposedly excess hiring (AMZN now has 1.6 million employees as of the March ’22 quarter), not to mention the “ad spending” segment which is 7% of revenue and expected to be slow, have all added up to catch up to the online giant.
It’s got a familiar ring to it, but the June and Sept ’21 quarters were the “peak” quarters for Amazon’s “operating EPS” which printed roughly $20 each quarter. Adjusted for the split, that was $2.00 per quarter in June and September of 2021.
The June ’21 quarter is also when Amazon started running into problems although EPS and revenue surprised on the upside, operating income fell 21%.
Here’s one Bespoke chart that I think explains a lot:
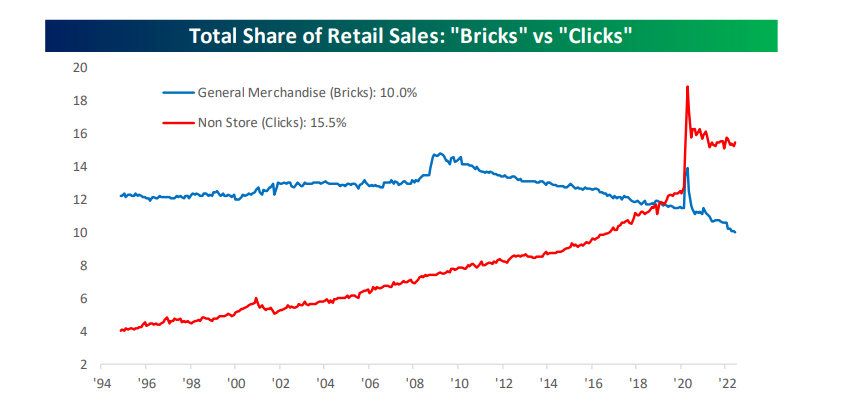
Maybe a better chart:
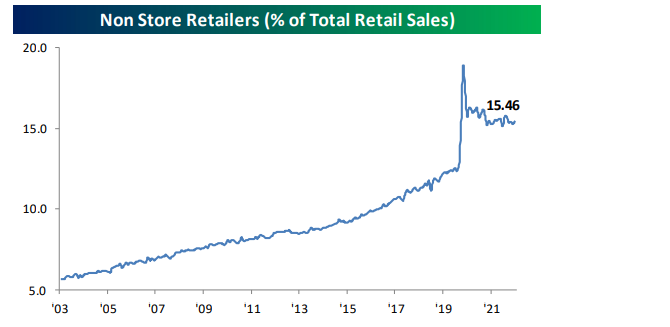
This second Bespoke chart published on the same day as Retail sales data, shows the surge in ecommerce, and then the slowdown since reopening.
With the start of the 3rd quarter, 2022, we start to exit this period and the very difficult comparisons.
AMZN’s current analyst consensus for ’22 and ’23 is for $0.63 on $520 billion of revenue for “expected” y.y growth of -70% on +11% revenue growth. Prior to 2022, Amazon had only one year of “below 20%” revenue growth and that was 2014’s +19%.
No question it’s been a sharp deceleration for Amazon coming out of the Covid-influenced years.
Estimate revisions:
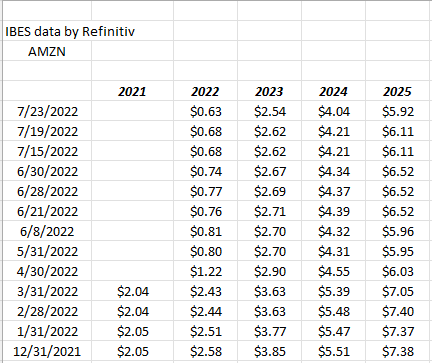
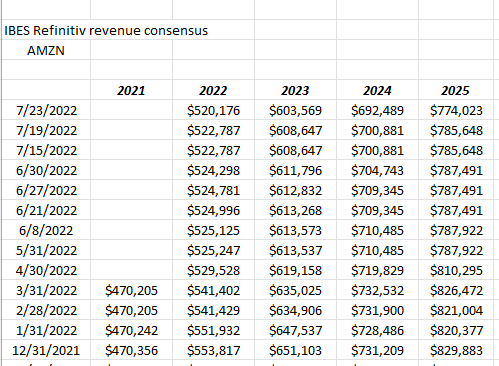
EPS estimates for 2022 and 2023 have fallen 75% and 35% since 12/31/21 and revenue consensus has fallen 9% and 7% respectively since 12/31/21.
That’s not good.
Readers will be left with one last table, showing y.y revenue growth for the Amazon business by segment:
![]()
Click on the above spreadsheet and expand it:
- The top line is the ecommerce division and readers can see the slowdown;
- The physical stores Jeff Bezos said he was going to work on when he stepped away from the CEO position, and revenue growth has improved but it’s just 4% of AMZN total revenue;
- Ad spending was only recently broken out and disclosed in late 2020. You can see the y.y trend in revenue for that segment;
- AWS is still strong as operating margin expanded 450 bp’s in Q1 ’22.
Summary: AWS is just 16% of AMZN’s total revenue but all of its operating income particularly with the troubles in 2022. I believe a lot of the Amazon issues in 2022 are due to the explosion in ecommerce in 2020 and 2021 and now 2022 is the hangover in terms of too much warehouse square footage, too many employees, and too much capital thrown at ecommerce, as it began to rapidly slow. However AWS continues to chug along quite respectably, with good margins.
Many technicians like the stock here with the bottom at $101 (it looks like a double bottom for AMZN on the chart) but the departure of both Jeff Bezos and Dave Clark is worrisome. The fact that the two left so closely together and had such organizational history is not a positive development. I like the fact that forward revenue estimates continue to grow albeit at a slower rate of growth, but that should change in 2023, maybe not back to 20% a year for the next decade, but Amazon and ecommerce continue to gain share against bricks & mortar and likely will continue to do so.
Morningstar assigns a fair value to AMZN of $192 per share which is a 37.5% discount to AMZN’s Friday, July 22 close of $122 per share.
I’ll be looking for the operating income number on Thursday, as well as the operating income guidance, particularly as we head into the holiday season. That will tell me if the issues that really showed up in Q1 ’22 are on the mend.
Trading at 148x 2022’s expected EPS and then 48x ’23 expected EPS and then 30x cash-flow, everything is out of whack for AMZN given Covid and the rapid deceleration.
I’m guessing AMZN reports a mixed quarter, with both good and bad.
Weekly summary: Potentially readers could be faced with slew of mixed earnings reports on Tuesday, Wednesday, and Thursday night, and yet the market could rally off Powell’s comments and body language Wednesday, we could see a upside surprise to Q2 ’22 GDP since we get the first look at it Thursday morning, and then the PCE deflator, which supposedly is more corporate-oriented and the Fed’s favorite inflation measure could start to reflect all this “disinflation” we’ve been seeing since mid-June ’22.
Remember, a lot could go right, but the week is packed with both mega-cap earnings and critical economic data.
Some technicians are looking at the improvement in the charts of the large-cap growth stocks, which like the lower 10-year Treasury yield and the lower Treasury breakevens, however it’s fair to say that this will probably be the least-exciting quarter for the megacap tech names in the last 3 years simply due to tough comp’s, compressed PE’s and a weaker operating environment.
Readers want to trade or get in front of positive earnings surprises and get out of potential negative earnings surprises but that’s a very tough game to play. Be patient and play a longer game. Wait and see what the numbers look like and the trends in revisions.
Last week Netflix (NFLX) guided Q3 ’22 lower and then the stock rose after-hours and traded higher on good volume the rest of the week. That was perfect price action for a truly beaten down large-cap growth stock. The decent chart was the set-up or tell into the earnings release.
Hope these insight help. Don’t be a hero. Invest cautiously but confidently.
I can’t remember a week where so much critical earnings and economic data is coming together in one week.
Thanks for reading.