Most interesting chart this week:
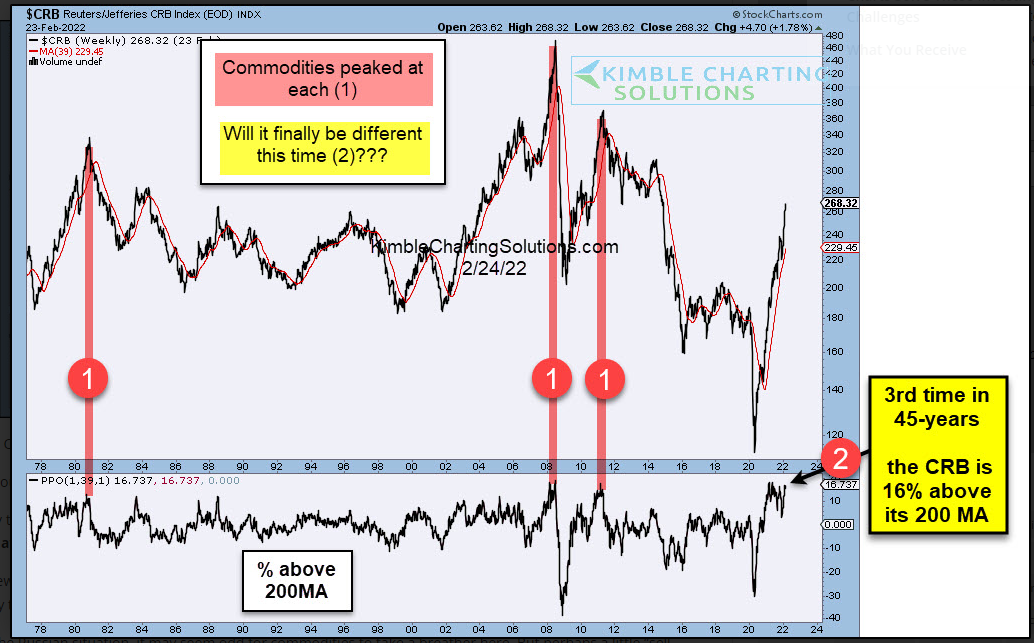
Chris Kimble of Kimble Charting Solutions is an excellent technician. Chris published this chart on Friday, February 22nd, 2022 (or at least that’s when it showed up in my email box) and it quickly caught my attention.
In my opinion, if you want one chart that personifies the risk in this market today, here it is in red and grey.
Think about if the commodity sector does break out from here: that means faster fed funds rate hikes (most likely) by Powell and the FOMC, downward pressure on stock prices and continued high inflation data.
Crude didn’t act particularly well this week with the Ukraine news. As of two weeks ago Energy was +25% on the year (per Bespoke) so that’s an over-crowded trade for sure. If crude oil and the commodity sector do break down here, it gives Powell much more latitude to be tempered about the coming fed funds rate hikes.
—————
The SP 500 managed to finish the week +0.10% higher, pretty surprising given the action on Wednesday, Feb 23rd.
Here’s the SP 500 earnings data from IBES by Refinitiv, by the numbers:
- The forward estimate rose to $226.70 this week, versus $226.41 last week.
- The PE ratio on the forward estimate ended the week at 19.4x;
- The SP 500 earnings yield ended the week at 5.15% versus the multi-year of 5.18% last week;
The expected SP 500 EPS growth rate for 2022 was 10% in October, but has fallen to 8% today, which isn’t that big of a deal, but readers can see how overall it will be a tougher year for stock returns.
Summary / conclusion: Speaking of charts, the SP 500 chart below shows the index sitting on the 50-week moving average.
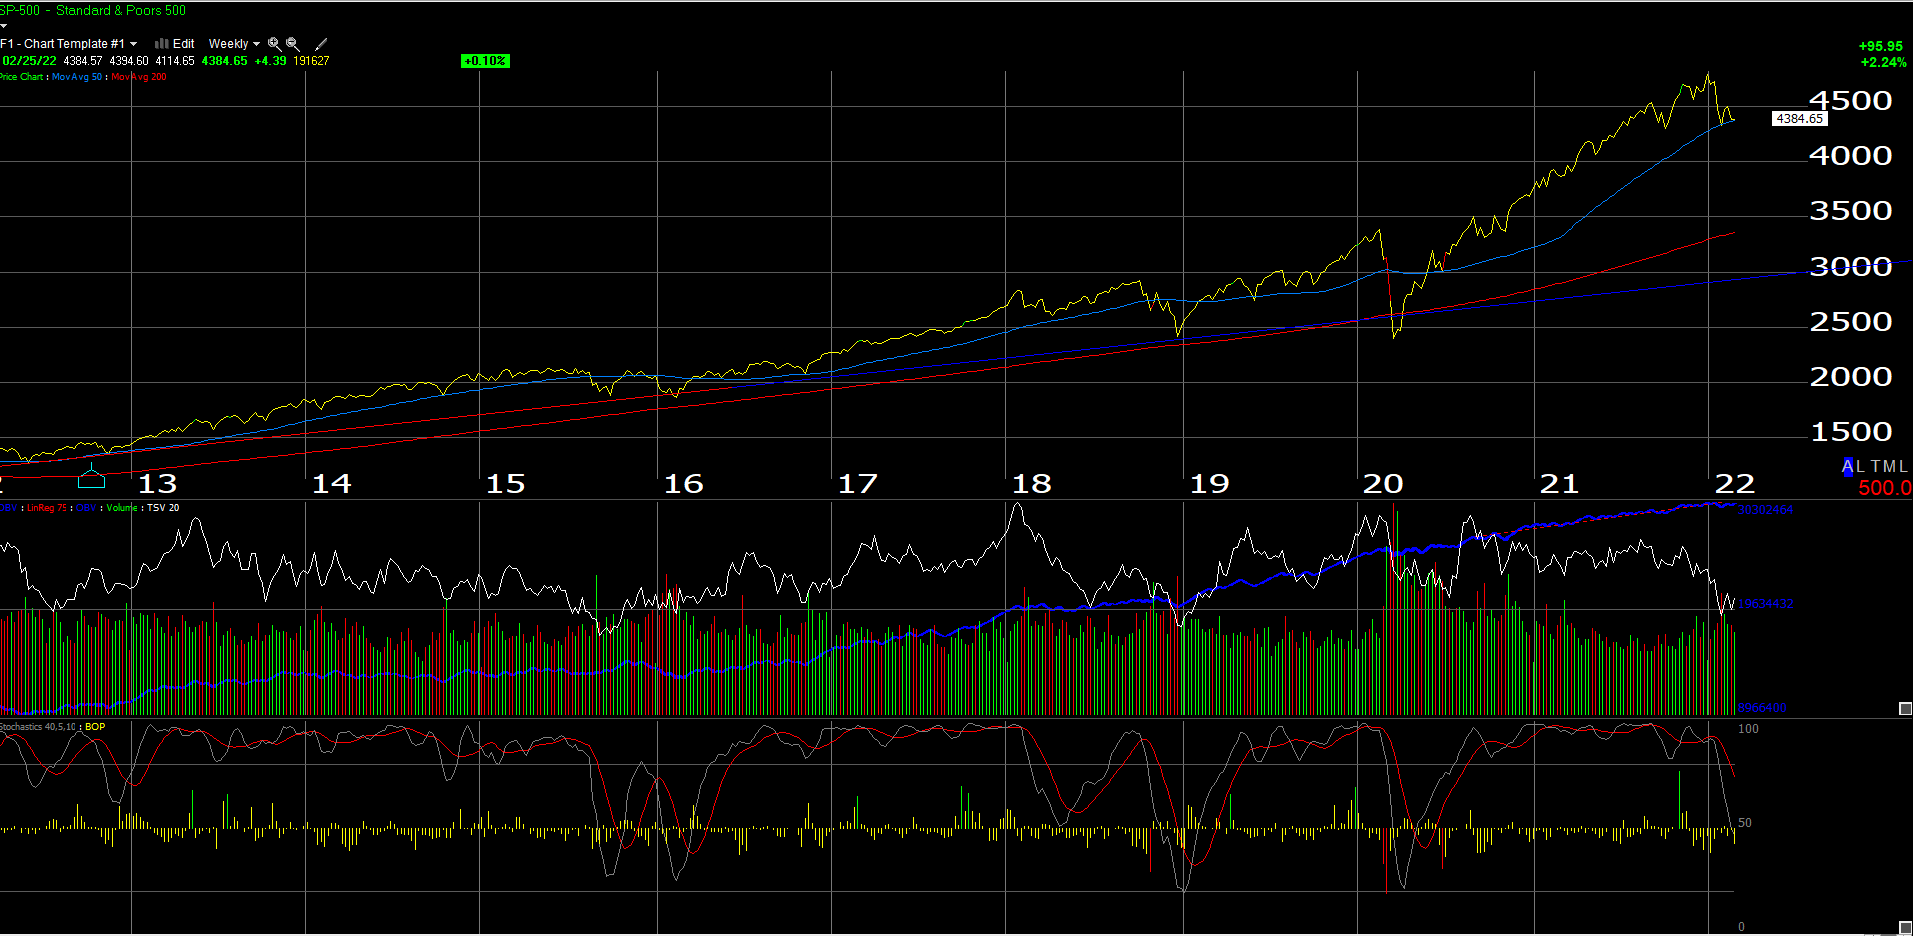 ]
]That blue line is a critical price level AND it’s being tested just as the commodity chart above is also showing a potential breakout is at hand.
The last time we saw a situation like this was the early 2000’s, with the tech-heavy SP 500 in the midst of a 50% correction, while commodities like crude oil, gold, silver, even fertilizer and coal were screaming higher.
Energy and Basic Materials comprise 5.2% of the SP 500 by market cap. Even if the sectors outperform dramatically, you have to own a lot to make a difference in the benchmark. While the Thursday turn-around rally this week was impressive (the Nasdaq was down 3% at one point Thursday morning, but ended the day 3.5% higher), I don’t think we are anywhere near being out of the weeds so to speak. The Fed’s mandate is going to keep a cap on stock and bond returns this year and it will be very much a stock-pickers market it seems.
Take all this with a grain of salt and substantial skepticism. Predictions are easy, but being right consistently is far harder. With Monday being the end of February ’22 and not a particularly good month to boot, readers might see another rally to end February ’22, and then all attention turns to the Fed.
Thanks for reading.