There is a few more blogs out there publishing research on SP 500 earnings and it’s good to see. The more attention the data gets paid, the more investors benefit from what is a pretty opaque process. One new SP 500 earnings blog is EarningsScout, which you can find on Twitter at @EarningsScout. The other blog that occasionally covers the topic is DataTrek, Nick Colas and Jessica Rabe’s blog started a few years ago.
In this DataTrek blog post, Nick Colas talks about the weakening in the Q3 ’21 bottom-up SP 500 EPS estimate on Monday night, September 20th, after the 1.7% drop in the SP 500.
Here’s this blog’s tracking of the Q3 ’21 SP 500 EPS estimate using IBES data by Refinitiv.
![]()
(Click on spreadsheet to enlarge the data)
DataTrek is right to point out that the Q3 ’21 bottom-up EPS estimate has weakened a little after peaking on August 6th, 2021, at $49.27, but it is only $0.30 lower 7 weeks later, with this week’s print at $48.97.
The other aspect to this is that the Q4 ’21 estimate (just above Q3 ’21) peaked just two weeks ago, and is a little weaker, but this is the typical normal pattern, with SP 500 earnings the last few weeks of one quarter and then the first week of the new quarter.
Here’s why the end of quarters tend to reflect a downward bias to estimates:
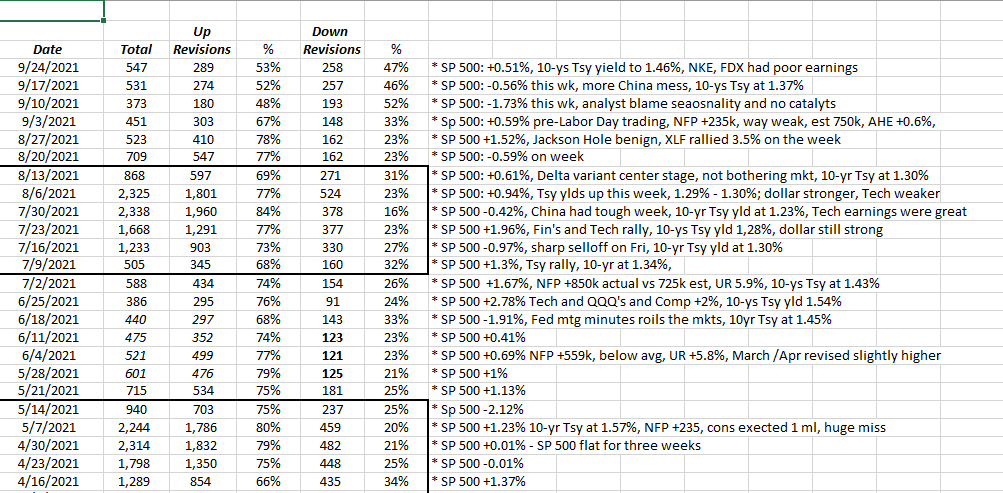 This spreadsheet which is updated weekly, dates back to 2010 and tracks weekly the positive/negative EPS revisions within the SP 500 from the IBES data by Refinitiv data set.
The 2nd column in from the left shows how the number of revisions dwindle quickly after the 15th of February, May, August and November. It’s usually Walmart’s report that represents the “unofficial end” to each earnings season since Walmart usually reports around the 15th of February, May, etc. and by that time typically 400 of the 500 SP 500 components have reported their results.
The analysts tend to stick with their models at the end of one quarter and the beginning of the other, absent news otherwise.
I’ve found looking at this data over years, that the fewer the revisions, the “rate-of-change” tends to weaken slightly. My impression watching this data over 25 years is that analysts were very bullish in the 90’s and then stayed too bullish after 2000 to 2009 decade began and then after 2008 became very reluctant to be aggressive with numbers in front of earnings, which meant that from the decade from 2010 to 2019, it was only “ex-post” that analysts moved their numbers higher.
I could be reading too much into the last 25 years, but that’s my sense after looking at the data all these years.
It’s certainly the case since the pandemic started, since the sell-side has DRAMATICALLY underestimated SP 500 EPS and revenue strength since June ’20’s quarter.
2022 Quarterly SP 500 EPS / Revenue Growth Estimates Being Revised Higher:
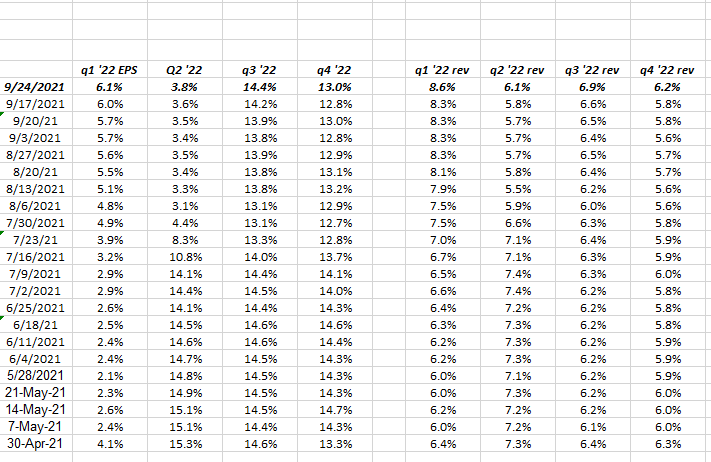
This data is taken from IBES data by Refinitiv’s “Earnings Scorecard” and is updated weekly.
This surprised me tonight, Friday, September 24th, 2021 when updating the 2022 SP 500 EPS and revenue growth rates by quarter for next year.
Look at the increases in expected growth rates quarter-by-quarter for SP 500 EPS and revenue.
It doesn’t seem like much but 2022 SP 500 EPS and revenue “expected” growth rates rose 20 – 30 bp’s for each quarter, just in the last week.
Here’s the change for Q3 – Q4 ’21:
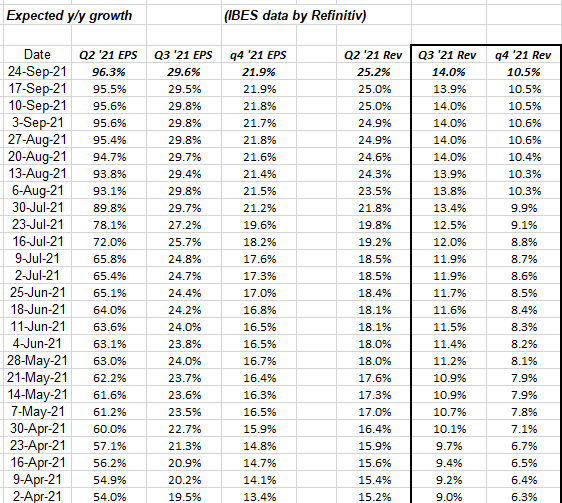
Again, this source data is from IBES by Refintiv “Earnings Scorecard” and is updated every week.
Note the upward revision to Q3 ’21’s expected EPS and revenue growth rates this week. And this is following FedEx’s and Nike’s disappointments this week.
Summary / conclusion: None of this is a criticism of any blog’s work or conclusions, rather it’s simply an additional voice in the “SP 500 earnings” crowd, from someone who is tracking the data for 20 years and writing about it for 11 years.
The one element that worried me this week about forward SP 500 estimates is the breakout in the 10-year Treasury yield above the Obama Administration lows, and the close for the week in the 10-year Treasury yield at 1.46%. Ultimately if the rise is sudden and sharp that will likely cause Street analysts to trim their numbers and more importantly higher Treasury yields will compress valuations.
The mega-cap growth stocks went nowhere from September 1 of 2020 to this summer as the 10-year Treasury yield climbed from 55 bp’s to 1.75% in March ’21.
It seems clear that the FOMC and the Fed is set to taper come November, December ’21. This could ultimately have a dampening effect on 2022 numbers.
It will be important to watch 2022 SP 500 EPS and revenue expected growth rates, starting around November 1 ’21.
It wasn’t until mid-January ’21 and then February 1 ’21, that the expected EPS and revenue growth rates really started to be revised higher for Q2 ’21’s record numbers.
Readers should take everything with a grain of salt. It could all change tomorrow and change drastically. Remember it’s about what can reasonably be expected or predicted versus what throws a wrench into everything. Capital markets change quickly and without warning/.
Thanks for reading.