Friday night’s post was a chance to show readers how much SP 500 revenue and EPS “expected” growth estimates have changed over the last 52 weeks.
If readers would have been shown the complete week-to-week data, you’d see how expected growth rates can change over the course of a year for forward estimates.
However, thanks to the pandemic, sell-side consensus has shown the last 5 quarters that analysts are waiting until they are right on top of the quarter or seeing the actual prints and management commentary before boosting their EPS and revenue estimates.
There is no question that the forward EPS and revenue estimates for the SP 500 are the Street’s best guess as to what the next 12 – 15 months will look like (and does look like) from a valuation perspective. Combine that with expected “sector” growth rates for EPS and revenue and we can compile an educated guess as to risk vs reward.
Hence watching the revisions (even small revisions) to expected growth rates is very helpful.
Looking at the 2022 “expected” growth rates for SP 500 EPS and revenue particularly since August ’21, readers are still seeing upward revisions.
Starting with Q3 and Q4 ’21 earnings reports and then 2002, the SP 500 should return to more “normal” expected growth rates for SP 500 EPS and revenue as we move beyond the Covid-19 and pandemic years of 2020 and 2021.
SP 500 data:
- The forward 4-quarter estimate for SP 500 earnings rose to $207.06 as of this past week, versus $206.88 last week. What’s possibly more interesting for readers is that the forward estimate was $199.34 on July 2 ’21, and $176.54 on April 2 ’21. That is a 17% increase for the SP 500’s forward estimate just since April 2, 21.
- The PE ratio on the forward estimate is now 21.4x versus last week’s 21.8x and the 21.5x print on July 2, 2021.
- The SP 500 earnings yield was 4.67% this week, versus 4.58% last week.
- The Q3 ’21 bottom-up EPS estimate is now $49.14. Expect that estimate to trade over $50 once Q3 ’21 earnings season begins.
CFRA / Lowry’s and Market Bubble Conditions
CFRA Lowry Research held a conference call this week, and talked about the market-cap issue for the SP 500 and what that portends. It’s an ongoing issue since today’s SP 500 looks a lot like late 1999, early 2000, with the tech concentration in the SP 500 and the Top 10 market-cap issues in the SP 500 today being 28% of the key benchmark.
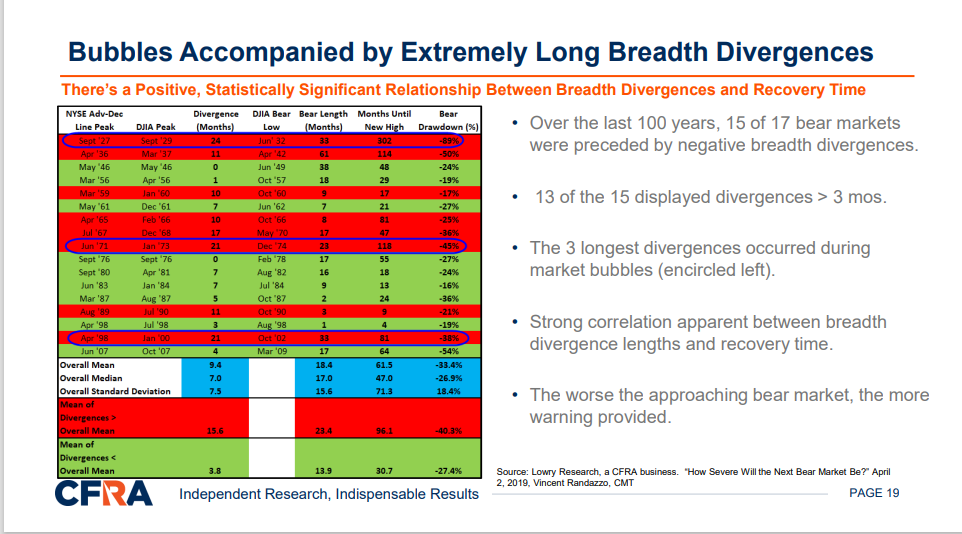
Without revealing the entire presentation, Lowry made the point that market bubbles are accompanied by extremely long breadth divergences (see link below)
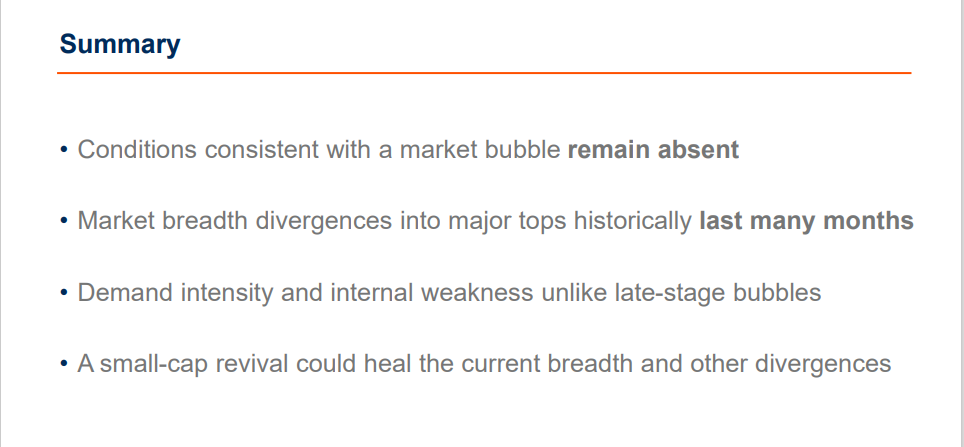
 and then with a number of additional slides, concluded that “conditions consistent with a market bubble remain absent” (see slide below).
Regarding market breadth, which is obviously a key metric when considering secular bear market setups, Lowry noted that:
- NYSE “all-issues” Adv- Dec line peaked July 2, while the Operating Companies Only (OCO) Adv-Dec line peaked June 8;
- The Nasdaq Adv-Dec line peaked February 2;
Summary / conclusion: As many have noted the SP 500 has been in a “stealth correction” all year. The latest stat to get some traction is that since the SP 500 peaked in early September ’21, declining 6 of the last 8 sessions, the magnitude of the drop has only been 2% – 3%, which is not (yet) a big deal.
The substantial difference between the tech and Top 10 SP 500 concentration today, and 1999, early 2000 is the “quality of earnings” of which Ed Yardeni has written about repeatedly in the last few years. When “tech” hit 33% of the SP 500’s market cap in early 2000, the SP 500 “earnings weight” of that concentration was just 13%. Today, with 27% of the SP 500 being tech today, the “earnings weight” is far higher, closer to 22 – 23%, and while Tesla is probably the largest weight in the Top 10 of the SP 500 with the biggest divergence between market cap weight and “earnings weight”, Tesla (TSLA) is part of the consumer discretionary sector along with Amazon (AMZN).
Personally, I would love to see a 5% – 7% correction within the SP 500 between now and October 10th, just to reset expectations, but I suspect Q3 and Q4 ’21 SP 500 earnings will be ok and more importantly the 2022 SP 500 EPS and revenue growth rate revisions are still ticking higher.
Remember too, just because the conditions aren’t present for a “market bubble” condition, doesn’t mean the SP 500 couldn’t see a substantial correction.
This could all change quickly with the tax bill and tapering (expected to begin in mid-November ’21) and a whole host of other “unknowns” that could strike unexpectedly.
Take everything you hear and read about the markets with a grain of salt and some degree of skepticism.
Thanks for reading.