According to Refinitiv, the firm (i.e. IBES) that provides the source data for the weekly earnings updates, had a data error during the week of July 30th, 2021, which was this blog post here, and it was corrected or started to be unwound with the August 6th, 2021, data (found on this blog post here), so I expect over the next few weeks, the data should sort itself out without too much of an issue.
Last week’s “Earnings Update” blog headline noted the sequential decline in the SP 500 calendar year SP 500 EPS estimates and it was obligatory to note the change in trend.
In fact there may have not been a change in the very positive trend of higher EPS estimates and higher revisions for the SP 500 EPS, (yet) and we’ll find out in the next few weeks.
The overall equity market isn’t signaling an issue yet.
SP 500 “average, annual” return:
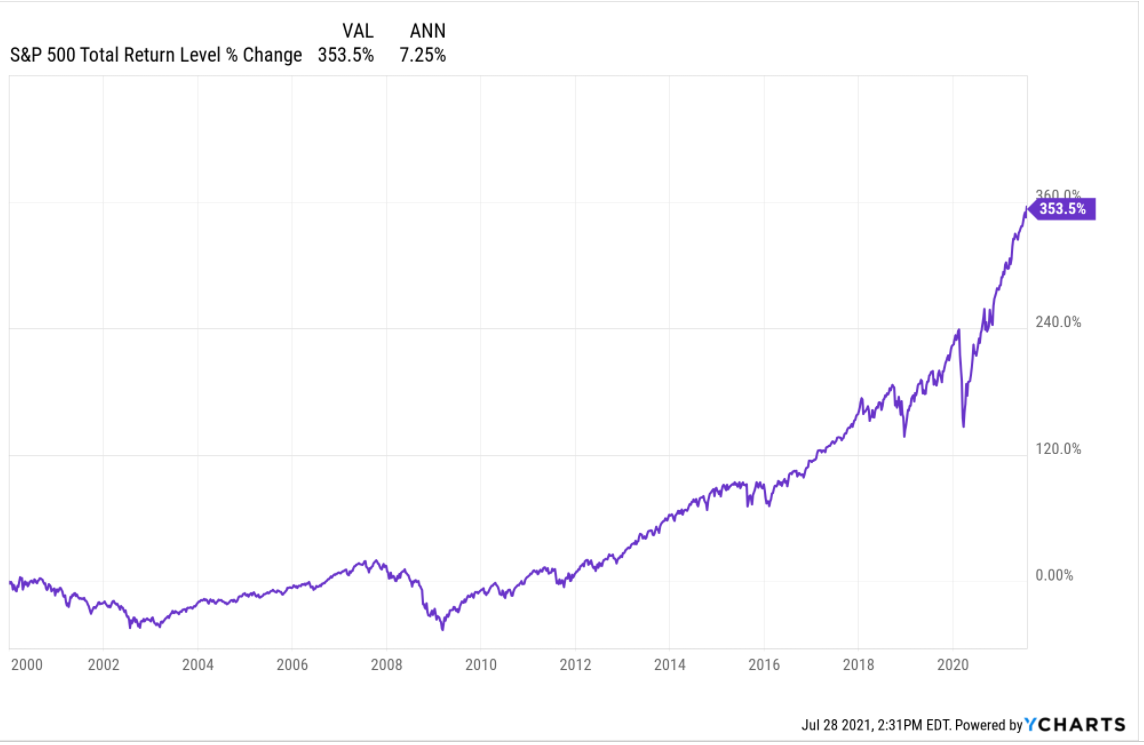
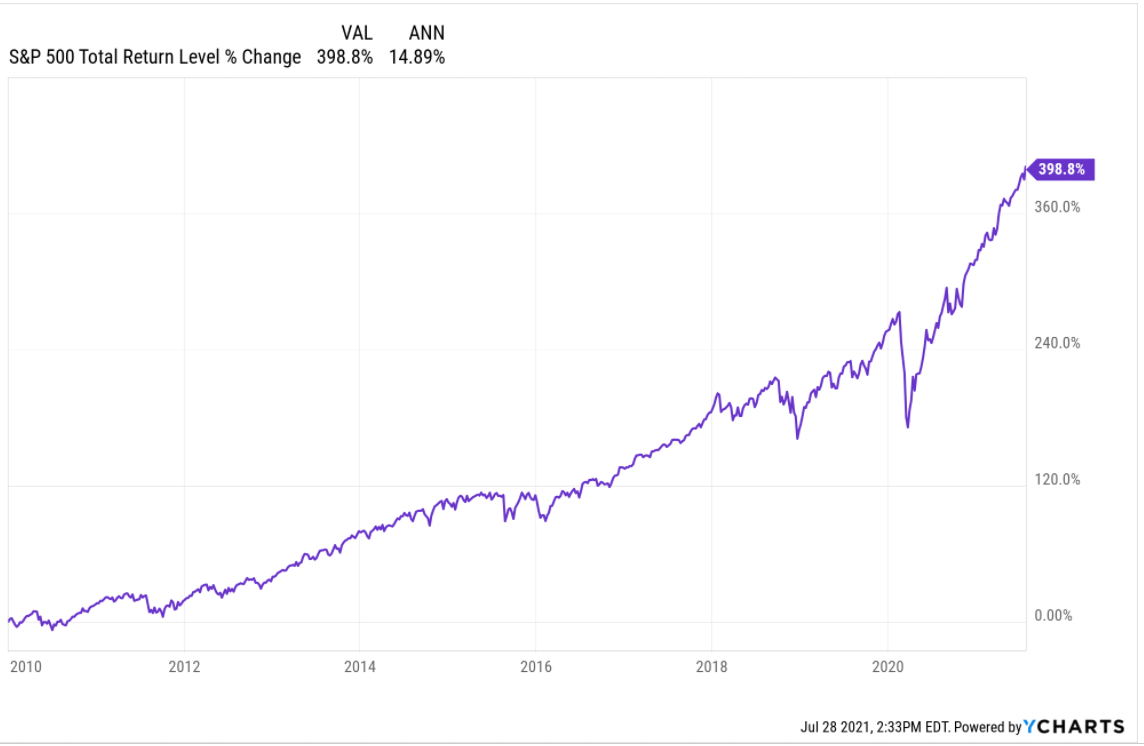
Source: Ycharts
You can tell Ycharts is a young start-up founded by new capital. It seems like the average age of every employee is under 30 and when I asked if I could get annual return data for the SP 500 and the QQQ (Nasdaq 100) for the decade from 1990 to 1999, you could almost hear the thought cloud appearing over the email thinking, “Wow, this dude’s old”. (Ycharts doesn’t have this data.)
The two charts above tell me that – in the near term last 11.5 years – the “average, annual” SP 500 return is pretty stretched, but the top chart – from January 1, 2000, showing the SP 500’s average, annual, return of just over 7% is consistent with the long-term return of the SP 500 in the post WW II period.
The Nasdaq and the mega-cap names have been weaker relatively speaking of late. Yes, higher interest rates could dampen the appreciation, but don’t forget the stronger dollar either. For the SP 500 as a whole, “non-US” revenue is roughly 40% of the total SP 500 revenue and for the technology sector, that percentage is greater than 50% now.
Summary / conclusion: Refinitiv disclosed a glitch in the SP 500 calendar year EPS data for 2021 – 2023 impacting data during the week of July 30, 2021, and then corrected it during the week of August 6th, 2021.
The “average, annual” returns for the SP 500 for the last 21 and last 11 years tell different stories. You could make the case – and I think we’d all agree – that the SP 500 and the general equity market could use a healthy correction given the return of the last 11.5 years.
The longer-term return is still indicative of normality.
The point about Ycharts and their data is that I’d like to show readers the late 1990’s period of cumulative returns for the SP 500 and the Nasdaq 100 just for comparative purposes, but Ycharts doesn’t have the data.
From a pure sentiment perspective, there is enormous differences between the late 1990’s (wildly bullish) and today (pretty subdued still, and cautious) and yet the returns aren’t too dissimilar.
Take everything here as one opinion and with great skepticism. It could all change tomorrow.
Thanks for reading.