This post will be kept short and sweet. Barrons is out this weekend as cautious on the “Big 5”. The numbers – in terms of EPS and revenue revisions – still look good, though.
As of Friday, July 30th, 2021, the SP 500 was up 18% YTD (the SPY that is).
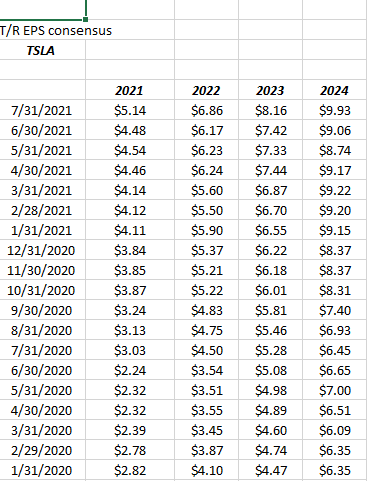
Tesla:
EPS revisions:
 Revenue revisions:
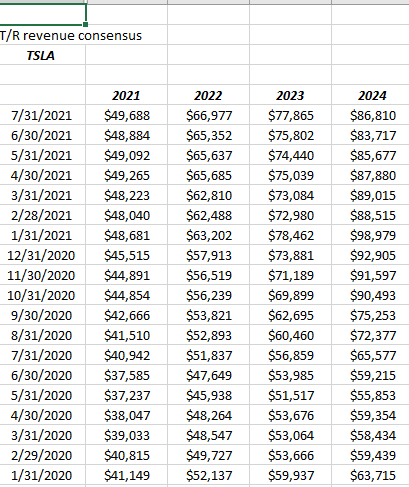 Tesla reported om July 26th, 2021, so there has been a little more time to get the full reflection of analyst estimates before July 31.
The positive revisions are clear for Tesla but here’s the rub, don’t rely on tracking EPS and revenue revisions exclusively. Positive revisions are a definite plus, but the stock’s valuation is critical and Tesla is an expensive stock, trading at at 133x expected 2021 EPS for expected 124% EPS growth this year. On a PEG basis the stock looks reasonable, but that assumes the expected growth will materialize or even improve.
Tesla is one of clients Top 10 holdings, but we are playing a very long game and often don’t buy full positions for clients. It was a smaller position prior to 2020 but grew into the Top 10 thanks to the 740% 2020 capital gain.
Morningstar boosted their “intrinsic value” on Tesla recently to $570 per share up from $354, but Morningstar’s fair value is still well below the current market price.
The July 26th earnings report for Tesla was pretty decent. Both auto revenue and auto margins were better-than-expected, with margins “ex” the EV credits.
Morningstar liked the “scale” in EV production which will give Tesla the cost advantage in EV production.
To be clear to readers, thanks to 740% return in 2020, more Tesla was sold than bought after January 1, ’21, but we have been adding in small positions as of late as the stock remains in a good technical position. Tesla is one of the best longer-term secular growers we see for the rest of the decade as “electric vehicles” (EV) will become more prevalent in the next 10 – 15 years.
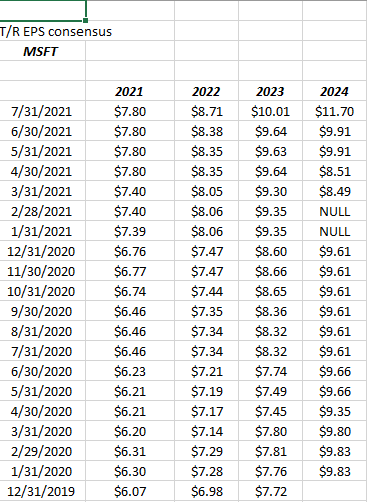
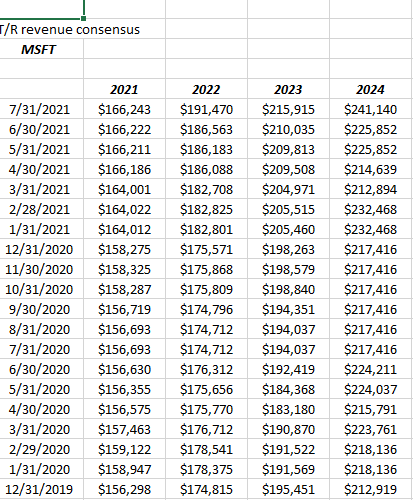
Microsoft:
EPS revisions:
Revenue revisions:
Remember, Microsoft numbers start with fiscal 2022, since fiscal 2021 ended on June 30, 2021.
Microsoft has another very good quarter with the June 30th results in late July ’21, with operating margins in the low 40% range for the 4th quarter in a row. Azure’s y/y growth rate has slowed slightly from 70% a few years ago, to 50% in this latest quarter, but you might expect that, given the base has grown. Intelligent Cloud (IC), which is MSFT’s segment that contains Azure, is now 38% of MSFT’s total revenue vs 29% in March ’18, while IC operating income is now 30% of MSFT’s total, versus 17% in March ’18.
MSFT’s guidance for fiscal Q1 ’21 ended Sept. 30th, 2021 was stronger-than-expected given consensus estimates, hence readers are seeing increases in EPS and revenue revisions for Microsoft.
Microsoft is trading at 33x expected 2021 EPS of $8.67, while expecting just 7% EPS growth this fiscal year. Readers need to consider that “pre-pandemic”, in December ’19, fiscal 2021’s EPS growth rate was expected at +11%, and came in at actual growth of 40%.
That’s the story with a lot of the SP 500: the sell-side consensus has really underestimated actual growth in the last 18 months.
Morningstar revised their Microsoft intrinsic value estimate from $278 to $325 with this latest earnings report, while this blog’s intrinsic value estimate is around $300.
IF EPS and revenue growth continue with their positive revisions and reasonable growth, Microsoft could go much higher, but that assumes the macro remains favorable to growth stocks.
The one aspect that is favorable to Microsoft’s business profile is that Productivity & Business (P&B), Intelligent Cloud (IC), and Personal Computing (PC) are each roughly a 1/3rd of Microsoft’s total revenue. IC is a little bigger given it’s growth, the secular slower-growing segments like P&B and PC, in my opinion provide a slower-growing base to the software giant.
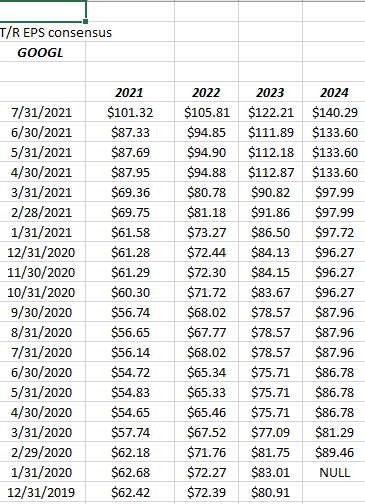
Alphabet (GOOGL):
EPS revisions:
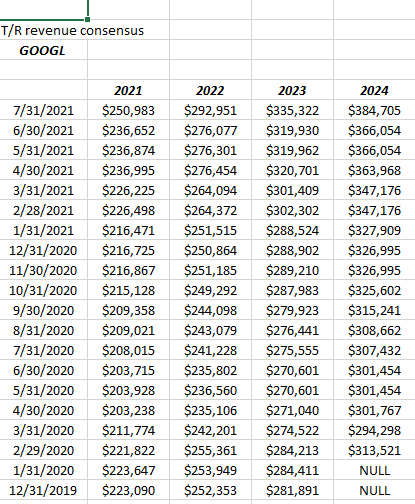
Revenue revisions:
If you sum the market-cap weights of Alphabet’s Class A & C shares, the sum is 4.27% as of Friday, July 30th, which puts combined Alphabet as #3 in the SP 500’s market cap rank. (Sorry, I still prefer to call it Google. Clients own only the GOOGL Class A shares.)
It’s truly hard to exaggerate how good a quarter Alphabet put up on July 27th, 2021.
Simply note the EPS / revenue revisions between June 30th and July 31 for the search giant.
YouTube and Google Cloud saw 84% and 65% y/y revenue growth respectively, while still less than 20% of Google’s total revenue respectively.
Being located in Chicago (or rather a Chicago suburb now after moving out of the city in July, 2019), Ive paid attention to what the Oakmark Funds are doing for years. OakMark is an excellent value shop, so when Bill Nygren started writing and talking about Alphabet (GOOGL), more wasn’t added since client’s already had a decent position, but it was more comforting knowing a value investor like Oakmark had taken a shine to what would other wise be a frowned-upon growth stock by the firm.
The $50 billion share repurchase plan announced by Ruth Porat in April ’21 was a big deal. Talk about catalyzing the stock.
Google’s ad revenue and cloud businesses are now benefitting from two of the biggest secular trends in technology.
Google is a top 10 position for clients, having returned 52% YTD in 2021 on top of the 30% in calendar 2020.
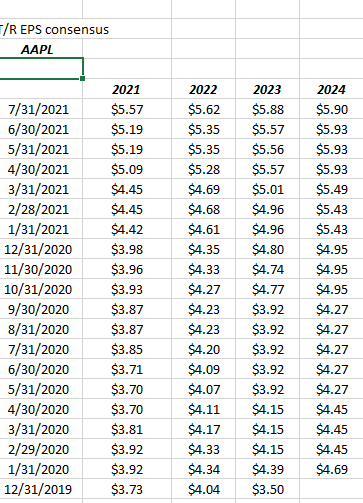
Apple:
EPS revisions:
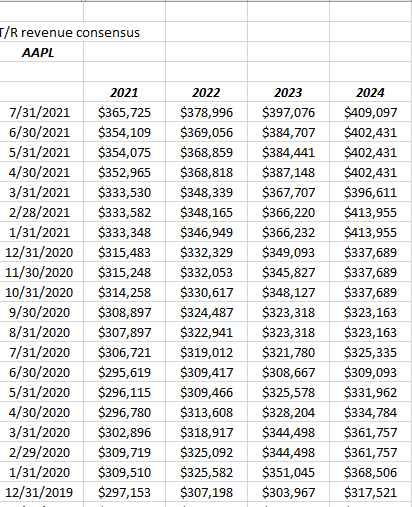
Revenue revisions:
The Apple numbers continue to look very good too, although a big chunk of the position was sold in 2018 when trade tensions heated up under the Trump Administration, and also – at least at that time – cash-flow and free-cash-flow started to flag a little bit as a percentage of net income. There are posts on the blog from that period talking about my perspective on Apple. In hindsight, the sale was premature to say the least.
The biggest plus seen from Apple’s quarter was that gross margin at 43% and change looked to hit an all-time-high while operating margins are close for the smart phone giant.
Total revenue grew 36% y/y, while iPhone revenue growth was 50% y/y, and China grew a very respectable 58% y/y.
Apple is trading at 22x and 24x cash-flow and free-cash-flow respectively, so the stock has seen some “multiple expansion” the last few years, but Apple is still a little cheaper than the rest of the mega-cap SP 500 on a valuation basis.
Most consider the stock fairly valued here as Morningstar raised it’s intrinsic value from $115 to just $124, and said it’s expected growth will slow at Apple.
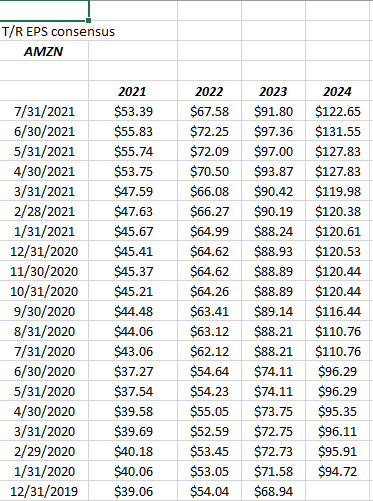
Amazon: (AMZN)
EPS revisions:
Revenue revisions:
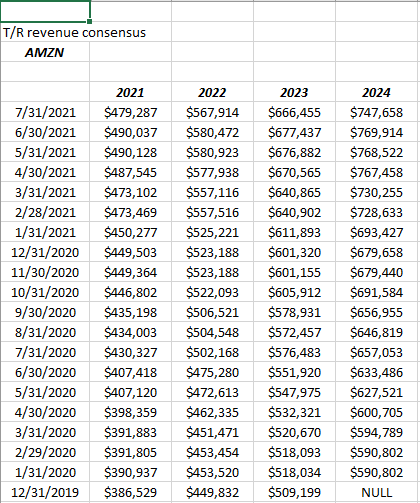
Amazon saw their EPS and revenue revisions turn negative between June 30th and July 31 of 2021, thanks to the poor earnings report and the likelihiid that analysts wanted to pull back on some of their rampant bullishness seen in Amazon the last 15 months.
What struck me with Amazon’s earnings is that free-cash-flow for the June ’21 quarter was negligible as “capex” expanded from $21 billion (TTM) as of the March ’31 ’20 quarter to $54 billion as of the June ’21 quarter. Amazon is still building out their support network after a huge spike in demand from the pandemic. (Capex is not expensed on the P/L, which is why it’s capex, but headcount and staffing and all the requisite support expenses occur when you get capex, which has been the buildout of the distribution centers in the last 10 – 12 years.)
One sell-side firm did note that the higher-margin businesses are still growing nicely. AWS and advertising will be the revenue growth drivers over the next few years, per the sell-side. Amazon discloses the AWS revenue and operating income (which we are grateful for). AWS is currently 13% of Amazon’s total revenue, but 54% of Amazon’s total operating profit.
Amazon has gone through these “investment periods” many times before this in the last decade. Usually the end of the “investment period” is signified by a blowout EPS number in the quarterly report and then the stock takes off.
The negative revisions in the July ’21 EPS and revenue estimates is a worry. The estimates will be checked again on August 30 and September 31 and the stock price will be seen every day.
Amazon has been range-bound since September 1st, 2020. The low over the last 10 months was $2,881 on March 5th, 2021.
If AMZN (the stock) takes out that March 5th, 2021, low that would be an issue. As of today, August 2nd, Amazon is still above it’s 200-day moving average.
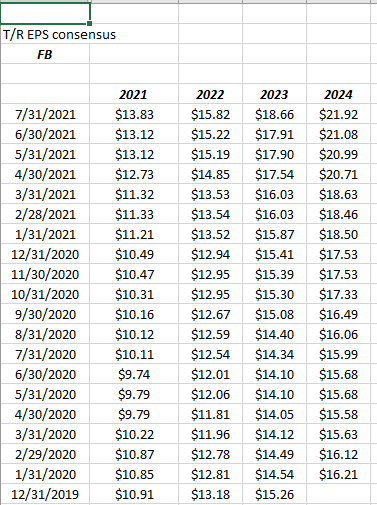
Facebook: (FB):
Revenue revisions:
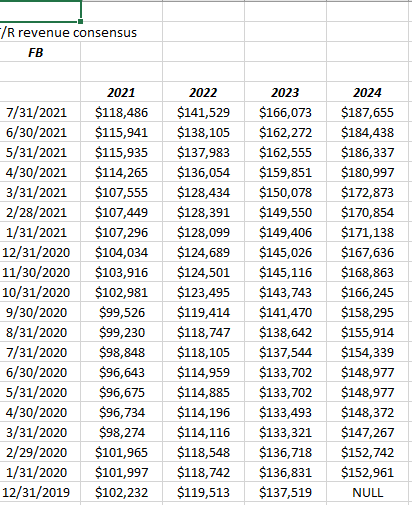
Facebook’s revisions still liik positive as during the pandemic, the ad revenue flagged, and then came roaring back by the end of 2020.
Like Apple, clients saw a lot of their Facebook sold in 2018 with the Cambridge Analytica issue. It felt like Mark Zuckerberg and Sheryl Sandberg were blatantly dishonest about that whole mess, but I also didn’t realize the prospects for Facebook Marketplace and how advertisers have much greater feedback and control on consumer interaction with Facebook ads.
The Facebook that was kept – some has a cost basis below $20 – it was purchased after the IPO and during the slide from $45 to below $20 – which is likely to be kept, but I worry about their editorial control and what seems like blatant censorship.
Prior to the whole Cambridge Analytica mess, I thought the mainstream media treatment of Zuckerberg was very unfair, but since then maybe the media had it right.
Anyway, there is little interest in repurchasing a big position in the stock.
Top 10 positions as of 7/30/21 and YTD returns:
- Microsoft: 29%
- BASIX – Blackrock Strategic Income Bond Fund +1.01%
- JMSIX – JP Morgan Income Fund: +3.5%
- Amazon +2%
- Schwab: +29%
- JP Morgan: +21.5%
- RSP: +20.6%
- OAKIX – Oakmark International: +11.9%
- Tesla -2.6%
- QQQ: +16.5%
The SPY had returned 18.06% as of Friday, July 30, 2021.
Summary and conclusion: Google and Microsoft had the best upward revisions of the mega-cap tech names, while Apple and Facebook were a little more muted, and Amazon’s downward revisions were a negative for sure.
When crude oil was plummeting from $90 a barrel in Sept ’14 to it’s lows near $28 in Q1 ’16, Amazon fell from $700 to $474 or 33% just on the overall market action alone. Nothing was wrong with Amazon as their subsequent earnings reports disclosed.
All the above names are very volatile. In the earnings preview, to the mega-cap names, the trends were obvious. For the overall SP 500, the mega-cap names have not only market-cap influence, but “earnings weight” influence. As was written on this blog this weekend, the overall increases in forward SP 500 EPS and revenue estimates are substantial, not a small amount due to last week’s mega-cap earnings reports.
None of these comments is a recommendation to buy or sell, but following the blog you can stay abreast of SP 500 earnings and see how clients are invested. Invest based on your own financial profile and your own appetite for volatility (i.e. risk).
Know too that the SP 500 and the stock markets are a “discounting mechanosm”. Stocks will and can peak and start to fall before fundamentals deteriorate, and vice versa too. Long-term laggards will start to move higher on seemingly no improvement in their fundamentals.
The biggest change in 2021 was that we sold the VWO or Vanguard Emerging Markets ETF, and am replacing the VWO with the EMXC or Emerging Markets Ex-China ETF. China is a bad actor. What they did to Jack Ma and Alibaba and Ant Financial is one thing, but what they are doing – or did – in Hong Kong is far worse.
That’s my biggest worry with mega-cap Tech and names like Apple. China is not only meaningful to Apple’s revenue but the production facilities are subject to Chinese influence and control as well.
We are in the seasonally worst two months of the year for the SP 500, i.e. August and September.
Thanks for reading.