The financial stocks that reported last week have all rebounded as the revisions remain positive for the sector in general, with Schwab and JP Morgan looking the best of the names previewed here. Goldman’s 4-quarter trailing EPS was a whopping $55.38 after it spent the better part of the last decade earning between $13 in EPS (2010) and $21 in EPS in 2019.
Here’s a quick preview of Big Tech reporting next week:
As of last Friday, July 16th, 2021, Tech’s market cap weighting in the SP 500 was 27.8% per IBES data. Apple and Microsoft are 19% and 17% percent of the Technology sector in terms of their respective “earnings weights” with the two stocks representing 6.5% and 5.7% market cap weights within the SP 500 respectively.
Apple: – Tech sector – reporting Tuesday, July 27th, 2021 after market close
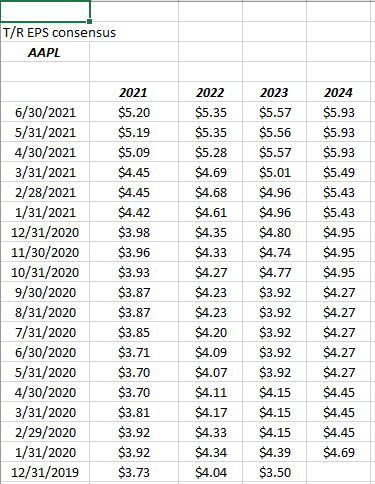
EPS revisions:
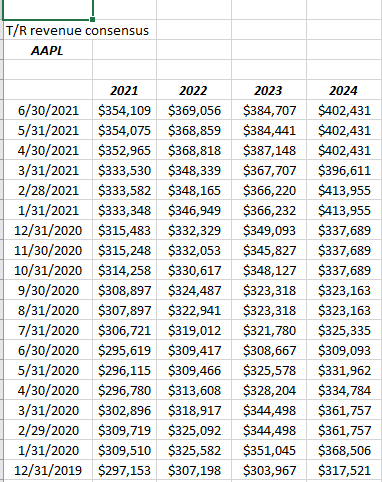
Revenue revisions:
Data Source: IBES data by Refinitiv
Commentary: Apple’s upward EPS and revenue revisions are a thing of beauty for data geeks, as both continue higher for all periods. For Apple it’s all about 5G, and while this quarter is Apple’s seasonally-weakest of the year, the September and December quarter again should – at least so far anyway – be another success story. Apple’s fiscal year ends September 30.
For next Tuesday, July 27th, 2021, the Street is looking for $1.00 and $73 billion in revenue for expected y/y growth of 37% and 22% respectively. This is typically Apple’s weakest quarter of the year, but it looks like EPS estimates have been trimmed just a little since the April ’21 report.
While EPS is expected to be up 57% this fiscal year for Apple, fiscal year growth is expected at just 5% and 4% for fiscal 2022 and 2023, given current consensus. Similar with revenue.
It’s interesting: last quarter Apple’s China business grew 87% y/y, against an easy comp sure. but still that’s pretty healthy. The political risk and what is happening in Hong Kong is still very worrisome.
The stock is pretty fairly valued here, and has been trading between $120 – $145 since last year. It will be interesting to see if management gives any early look at fiscal ’22 guidance.
For Apple it’s all about fiscal 2022 numbers and guidance now.
Microsoft – Tech sector – also scheduled to report Tuesday, July 27th, 2021 after the market close
Microsoft is expecting $1.90 in EPS on $44.1 billion in revenue for expected y/y growth of 30% and 16% respectively.
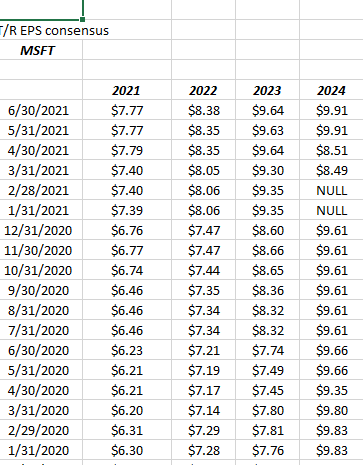
EPS revisions:
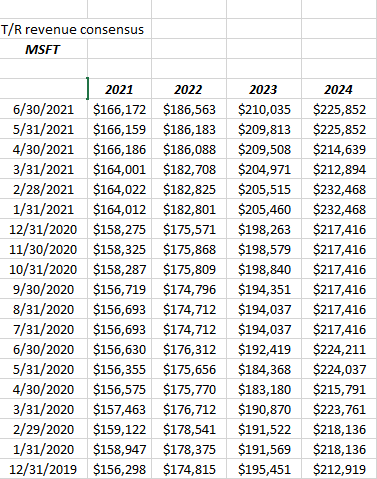
Revenue revisions:
Source: IBES data by Refinitiv
Commentary: Microsoft’s fiscal 2021 ended June 30th, so it will be all about the guidance for fiscal 2022 when Microsoft reports next Tuesday, July 27th, 2021.
Like Apple, Microsoft is expected to grow EPS 35% and revenue 16% in fiscal 2021, but the slowdown for 2022 isn’t near as dramatic as Softee is expected to average at least 10% EPS growth in fiscal ’22 and ’23, with revenue to grow mid-teens, and that’s before hearing the 2022 guidance.
MSFT’s operating margin expanded 400 basis points last quarter, against an easy comp and has been in the low 40% range the last 3 quarters.
YTD, MSFT is up 27% versus the SP 500’s 16% return as of 7/21/21.
Trading at 33x expected fiscal 2022 EPS of $8.38, the stock looks expensive on a PE basis given the expected 8% – 10% growth in 2022. When tax reform was passed in late 2017, Microsoft had $142 billion in cash and investments. As of 3/31/21, that same number was $127 billion.
Azure’s growth rate – part of Intelligent Cloud – is slowing from the 70% y/y rate to the 50% range the last few years, and likely will continue to do so as the base grows, but the cloud – from most informed perspectives – still seems very much in a secular growth mode.
Amazon – Consumer Discretionary sector – reports July 29th, 2021 after market close
Amazon’s EPS weight within the Consumer Discretionary sector is 18.1%, while it’s market cap weight in the SP 500 is 4.15%.
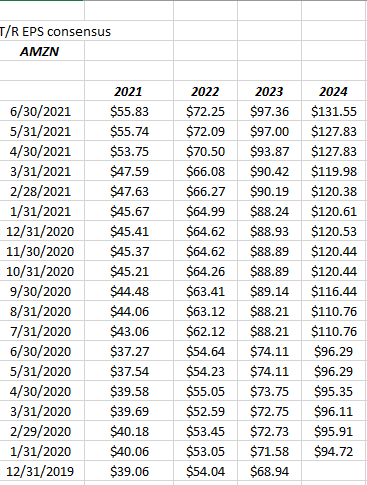
With current IBES by Refinitiv consensus at $115 billion in revenue and $12.25 for EPS for the Q2 ’21 for Amazon, the expected y/y growth is 29% and 12% respectively.
![]()
With the $12.25 EPS expected for Q2 ’21, note the upside surprises for Amazon’s EPS since the pandemic started. The column to the far right is the 12/19 quarter.
EPS revisions:
Revenue revisions:
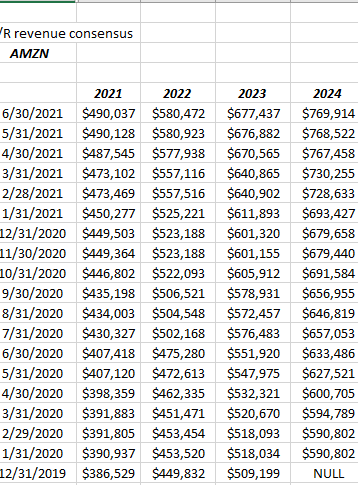
Data source: IBES data by Refinitiv
Commentary: And no flies on those numbers – look at those positive revisions.
The Street currently consensus – over the next 3 calendar years i.e. 2022 – 2024 – is expecting 29% EPS growth and 21% revenue growth for the ecommerce giant, and is currently trading at high 50’s – low 60’s PE on the ’22 estimate. Amazon is set to overtake Walmart in total revenue in calendar ’22 although that is somewhat deceptive since “online” or ecommerce revenue is roughly 50% of Amazon’s total. Including 3rd party sellers, that portion of Amazon’s total revenue is 71% – 72%.
Using today’s consensus, 7/22/21, Amazon is expected to generate $560 billion in revenue in calendar 2022.
Given current trends and EPS estimate revisions, Amazon could be earning $100 per share in 2023. The current consensus EPS estimate for 2023 is $98.07.
There is nothing that isn’t frightening about Amazon’s valuation, so tread carefully. The only metric that seems reasonable is the 26x cash-flow metric, but it’s only reasonable relative to the rest of Amazon’s valuation metrics.
From a bigger picture perspective, Amazon is tied to the 2/3rds of US GDP i.e. consumption. Amazon (the stock) has been subject to sharp corrections with market corrections over the last 10 – 11 years.
Alphabet (GOOG/GOOGL): Communication Services sector – per Briefing.com, Alphabet is expected to report July 27th, 2021 after the market close
Alphabet has a 28.5% EPS weight in the Communications Services sector, and has a total 4.11% market cap weight within the SP 500.
Per the IBES data by Refinitiv, Alphabet’s consensus EPS estimate for next Tuesday night is $19.34 while the revenue consensus is $56.2 billion, for expected y/y growth of 91% and 47% respectively.
EPS revisions:
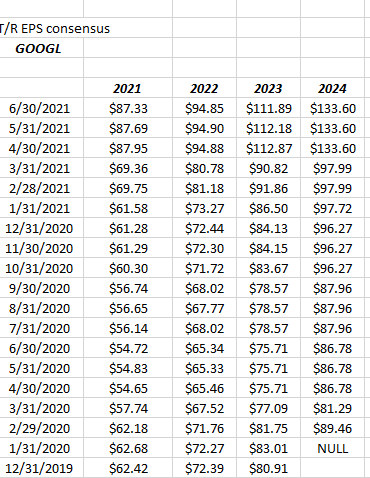
Source data: IBES data by Refinitiv
Revenue revisions:
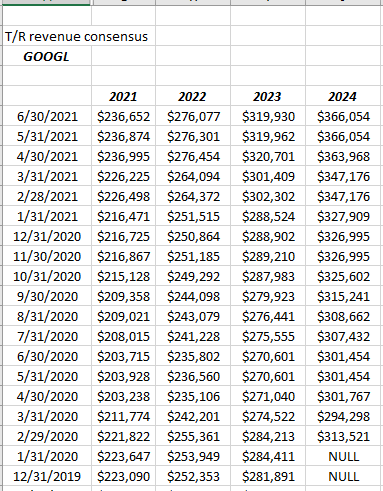
Source data: IBES data by Refinitiv
The big news last quarter was the $50 billion share repurchase program that CFO Ruth Porat announced for Alphabet. EPS were revised sharply higher after the April ’21 report. Check the above spreadsheet – note the increase in EPS estimates between the March ’21 and April ’21 quarters. Ad revenue grew 32% y/y while Google’s cloud initiative is getting real traction growing 46% y/y. With YouTube, the cloud, the stable search business, Alphabet is hitting on all cylinders.
On a PE basis, Google remains relatively cheap trading at 26x the expected 3-year average earnings from 2021 to 2023, which is expecting an average EPS growth rate over the next 3 years of 25%.
The cash position as of 3/31/21 at $132 billion is or was 9% of Google’s market cap.
Clients own just GOOGL in their accounts. The stock remains inexpensive and relatively cheaper given expected growth rates and cash-flow.
Summary / conclusion: A conversation with Norm Conley last weekend, a former co-contributor at TheStreet.com and a $1 billion asset manager in St. Louis, prompted me to ask IBES and Refinitiv for the “EPS weights” of tech’s Big 6 headed into earnings next week. It would be better to compare apples-to-apples, i.e. SP 500 EPS weights vs SP 500 market cap weights of each of the companies, but that’s how IBES / Refinitiv provided the data.
It surprised me that Apple and Microsoft are 37% – 38% of the tech sector’s EPS weights. At one point, both companies were 50% of that same metric. My guess is Apple’s split had something to do with this.
The top 5 companies within the SP 500 are now 20% of the SP 500’s market cap weight. Think about that – it’s an index with 500 names.
Remember do your own homework, and base your investing on your own appetites for risk and volatility. Consensus EPS estimates can and do change quickly and individual stocks will begin rising from long bases and falling from long uptrends, well before fundamentals get reflected in valuation(s).
Most of client’s Facebook was sold. That place seems to be a mess. It’s still owned in some client accounts that are very tax-sensitive, some with a cost basis below $20.
Thanks for reading.