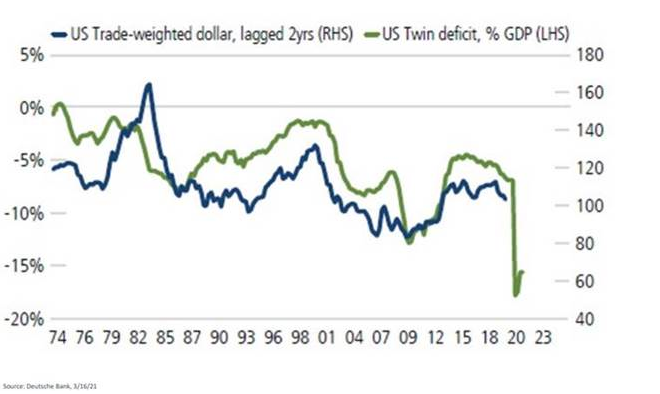
The first chart today (click to expand) was provided by Brian Buonamici at Calamos Asset Management last week. If you’re wondering about the potential direction for the dollar, the downward trend look like it will resume thanks to the “twin” trade and budget deficits. That’s a long chart in terms of time frame.
With the “monetary policy hawks” emerging more and more at the Fed (not necessarily voting FOMC members, though) perhaps the dollar downtrend will be delayed.
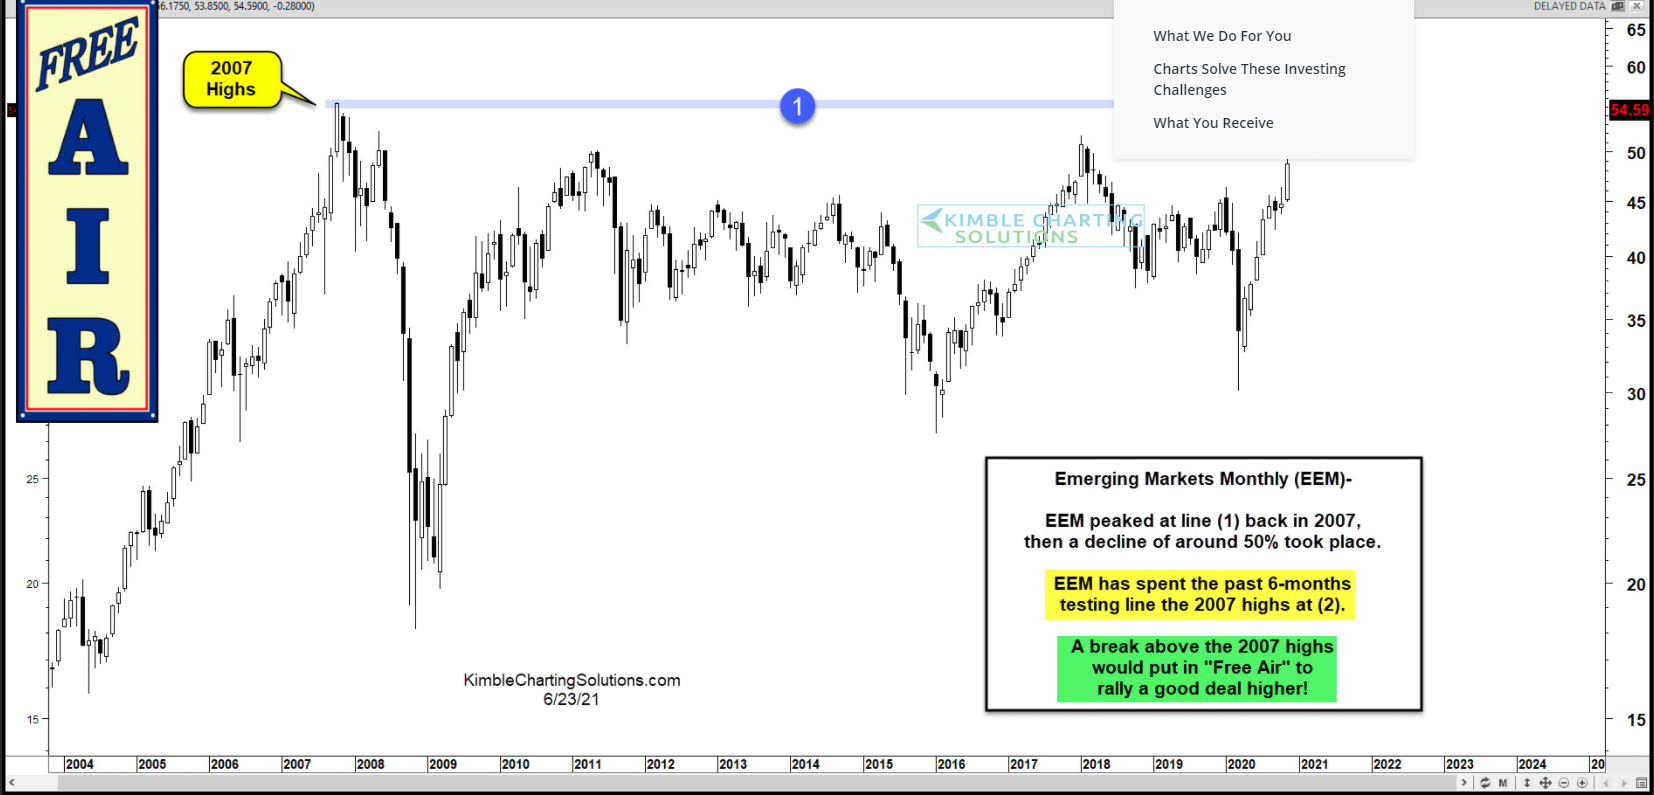
This chart is courtesy of Chris Kimble, a great technician out of Cincinnati. He’s noting the EEM is poised to take out 2006 highs.
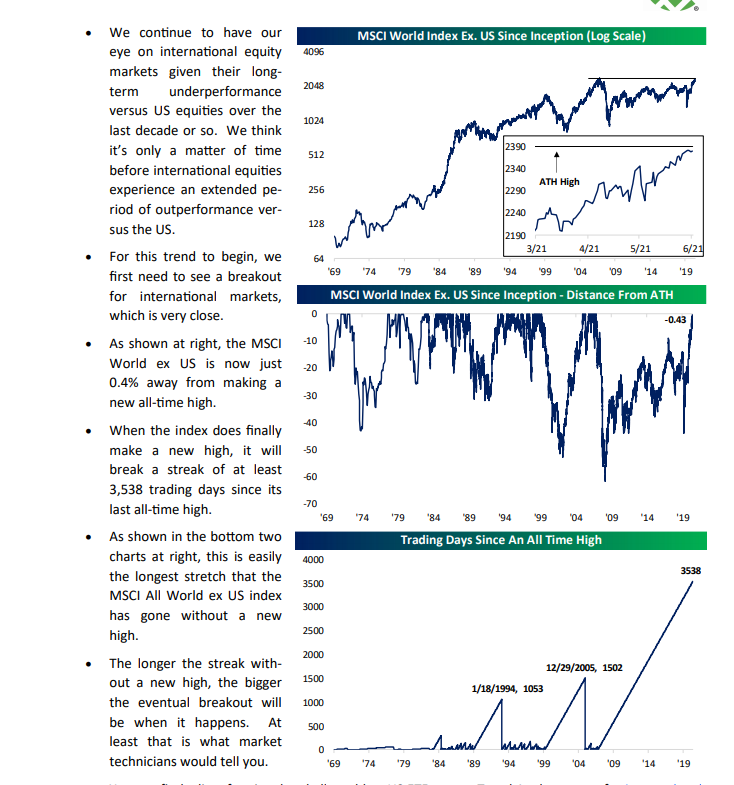
Finally, from the June 11, ’21 Bespoke report, Paul Hickey notes (above) the MSCI World Index (ex US) has seen over 3,500 trading days since it’s last all time high.
Be sure and read the Bespoke comments to the left of the charts.
Summary / conclusion: The VWO is the only emerging market position now, and the non-US exposure is represented by the Oakmark International Fund run by David Herro, the fund having recently made an all-time-high over $31 per share. Clients emerging markets allocations have been gradually increasing since the initial 2% – 3% weight in Q1 ’16, after emerging markets saw a negative 10-year return on the asset class as of the end of Q1 ’16.
Truth be told, the VWO position is making me nervous after the Hong Kong headlines from yesterday, where the CCP shut down the last remaining (?) pro-democracy newspaper. Also, the heavy handedness around Jack Ma and Alibaba late last year, resulting in Jack Ma going into self-imposed isolation seemed to put a pall over the large-cap Chinese tech companies.
Don’t kid yourself – China is not “pro-democracy”, they do not want a free press, and the government exerts enormous control over the multi-national Chinese businesses.
Here’s the issue with China and emerging markets: China is the lion’s share of the EM benchmark, like large-cap Tech is the lion’s share of the SP 500. I think China’s weight in the emerging markets benchmarks is about 32%. There is an emerging markets ETF that doesn’t have any China company exposure (ticker – EMXC) which has only been trading 4 years or so, and with much lower average daily volume.
President Trump’s China trade policies along with Brexit really cooled EM and international over the last 4 years, but now with a global growth spurt emerging post Covid-19, and the fact that basically every major economy in the world wants to reignite growth, perhaps we finally get the long-awaited breakout for many of these countries.
Here’s the most compelling statistic to own EM ETF’s
Average, annual returns since 12/31/2006:
- EEM: +3.26%
- VWO: +3.07%
- SP 500: +10.38%
Take everything you read with a grain of salt and a healthy skepticism. Invest your funds based on your own financial profile, and your own appetite for volatility. Markets can change and change quickly, and often adversely.
Thanks for reading.