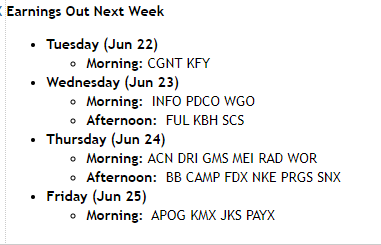
Per Briefing.com, here are the companies expected to report May 31 quarter end earnings next week. The two that I model and own for clients are Fedex and Nike, both world-class brands, and both report Thursday afternoon, June 24th, 2021. Presently own more FedEx than Nike, and neither position is top 10. Paychex (PAYX) will give readers greater insight into private sector payrolls and where payroll growth is actually occurring (which sectors that is), which is a Friday morning release.
Charts and Tables:
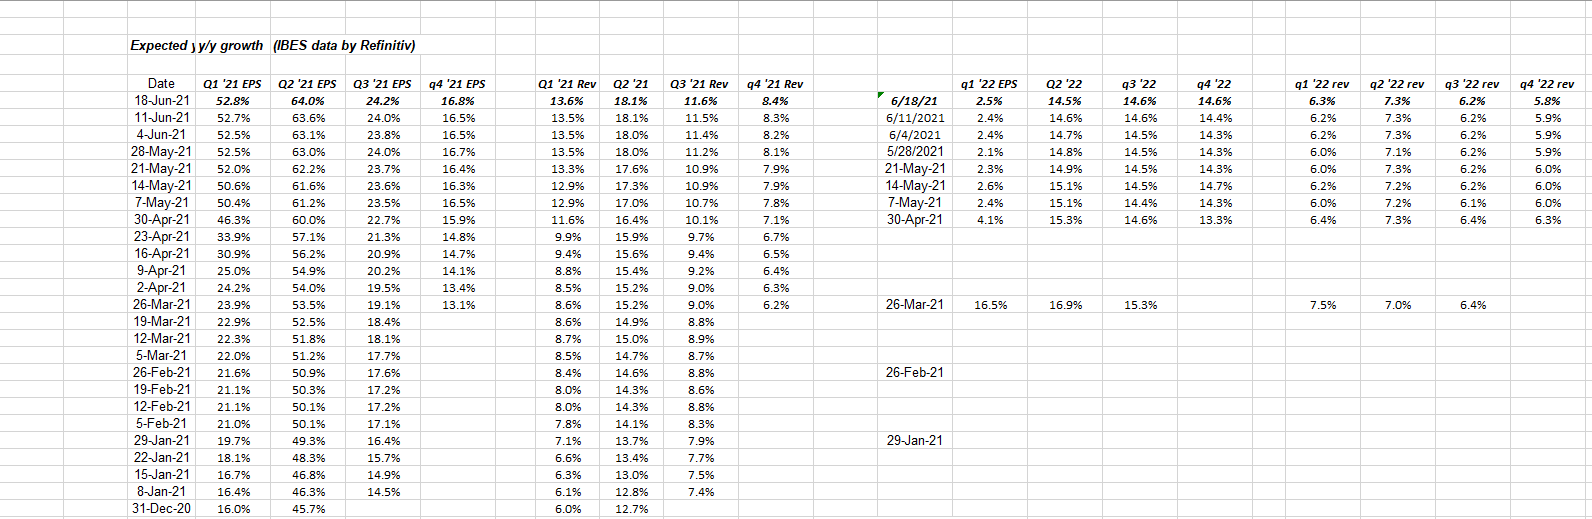
Data Source: IBES by Refinitiv
This table I crafted to myself to show readers the progression in “expected” EPS and revenue growth rates over the next 8 quarters, or through the end of 2022.
Just to demonstrate to readers how dramatically the Street has underestimated SP 500 earnings growth, note in the first column or Q1 ’21 expected EPS growth, that on 12/31/20, the expected growth rate for Q1 ’21 SP 500 EPS was 16% y/y. By today, June 18th, 2021, the Q1 ’21 “expected” growth rate, which will be pretty close to the actual growth rate, is 52.8%. That is quite an underestimation of SP 500 EPS growth.
How will Q2 ’21 SP 500 EPS growth look ? Since 12/31/20, the expected growth rate has already risen 20% or 2000 basis points, from 45.7% to 64% as of today. My educated guess is that will be higher by mid-August ’21, maybe much higher, as we lap the last easiest quarterly compare for the pandemic-impacted SP 500 in 2020.
Will it matter to stock prices though, that is the question ?
Forward-4 quarter EPS curve:
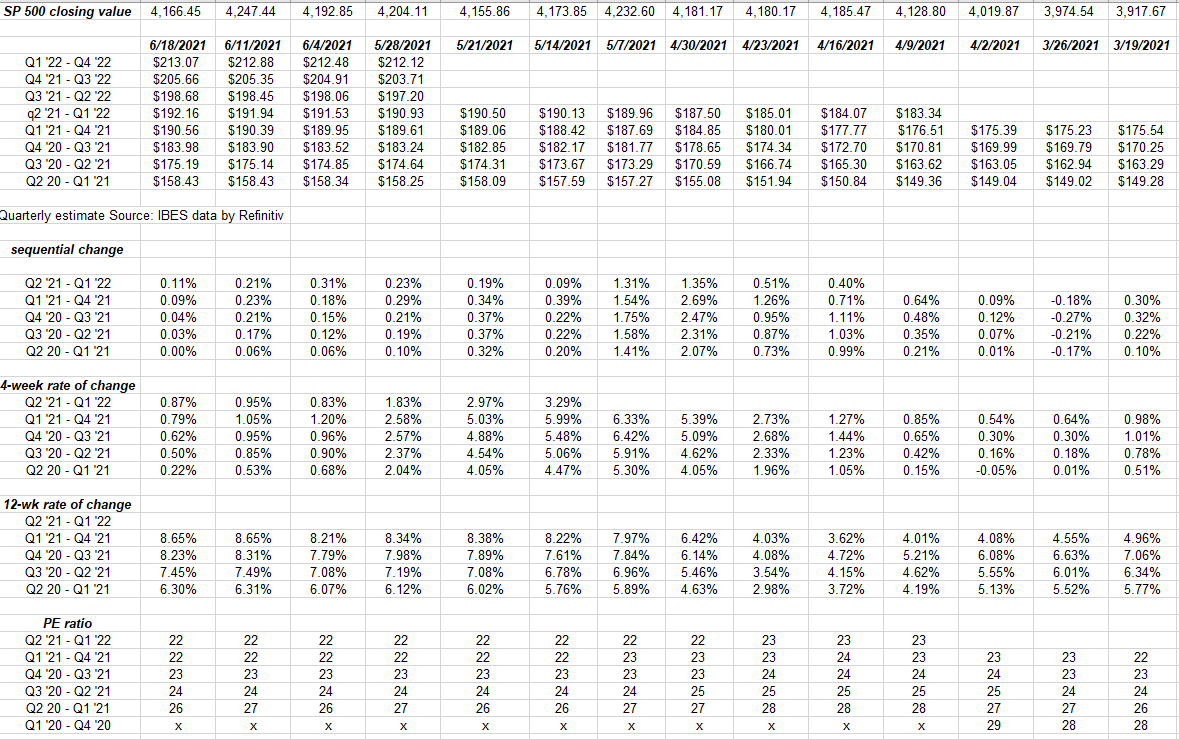
Data source: IBES by Refinitiv
Again, the goal of this table was to plot forward SP 500 EPS points by rolling quarter to see what the Street is saying for various timeframes.
Expect the forward estimates to stagnate or even decline a little in the next two – three weeks as we near the end of the 2nd quarter and begin the third. The analysts slow their revisions and usually wait until the full quarter is done before updating their models.
Again, like the last few weeks, note the “12-week rate of change”.
Remains robust.
Last chart:
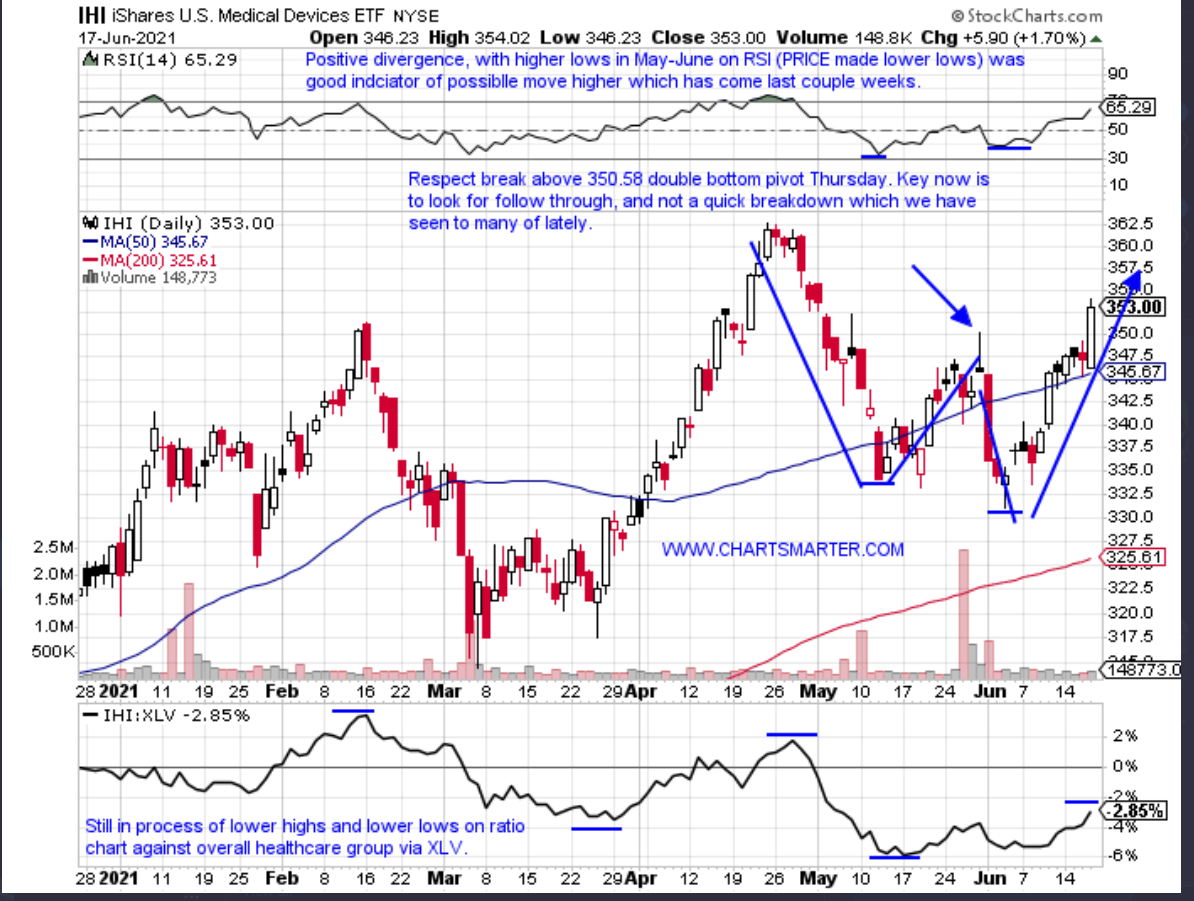
Doug Busch, a pretty good technician who occasionally sends me his work, posted this chart of the IHI to Twitter today. Currently long the IHI ETF for clients, IHI looks poised for a another breakout. Doug’s Twitter handle is @chartsmarter.
Finally, the key SP 500 data that is sometimes inadvertently not updated regularly for readers:
- The forward 4-quarter EPS estimate for the SP 500 rose again this week to $192.17 from last week’s $191.93.
- The PE ratio on the SP 500 forward estimate is 21.68x.
- The SP 500 earnings yield rose to 4.61% this week, the highest print since January 29th, 2021’s 4.61% and before that the 4.70% in May ’20.
- For most of 2019 or “pre-pandemic” the SP 500 earnings yield averaged between 5.30% and 5.80%.
- The Q2 ’21 quarterly bottom-up estimate this week was $44.69 the same as last week. As the opening paragraph in “Charts and Tables” above suggested, the expectation is that Q2 ’21’s final bottom-up estimate should be above $50 by mid to late August ’21.
Summary / conclusion: With just 8 trading days left in the 2nd quarter, the correction this week appears to be Fed-driven. Powell’s comments this week and the flattening in the yield curve looked to catch investors off guard.
The selling in the SP 500 has been mainly all the sectors which took off on November 1, 2020, i.e. Financials, Basic Materials, Commodities, etc. Listening to Fast Money as this is being written on Friday afternoon, June 18th, 2021, Melissa Lee noted the damage to the KRE or regional bank ETF, which was down 7.2% this week, with half the drop coming today, but the CNBC chart noted the KRE is still up 57% over the last 12 months.
This correction was a long-time coming. I’m trying to think of when the last 10% correction was for the SP 500 – peak-to-trough and pre-pandemic – and just from eyeballing the chart, it was probably Q4 ’18. It’s been a good market for a while.
The SP 500 earnings trends are still fine, but take everything you read on this blog and any other blog with substantial skepticism. Invest based on your financial profile, and you ability to handle market volatility. The markets – both stock and bond markets – can change suddenly. Markets can change direction for some time without the underlying secular bull or bear market remaining unchanged.
Thanks for reading.