Not to be trivial about it, but little has changed in terms of the upward revisions to EPS estimates for forward quarters for the SP 500.
After the 4th quarter correction in 2018, which occurred 2 full years after Yellen started hiking fed funds, I went back and looked at the “forward 4-quarter” data, and the week the SP 500 peaked (late September ’18), the forward 4-quarter estimate started to tick lower sequentially.
Hence, tracking the sequential change in the forward SP 500 EPS curve became a new task every week. To see if there is any predictive power in the data, this blog also added the 4-week and 12-week rate of change for the forward quarters SP 500 EPS curve. (See first table below.)
SP 500 forward EPS curve:
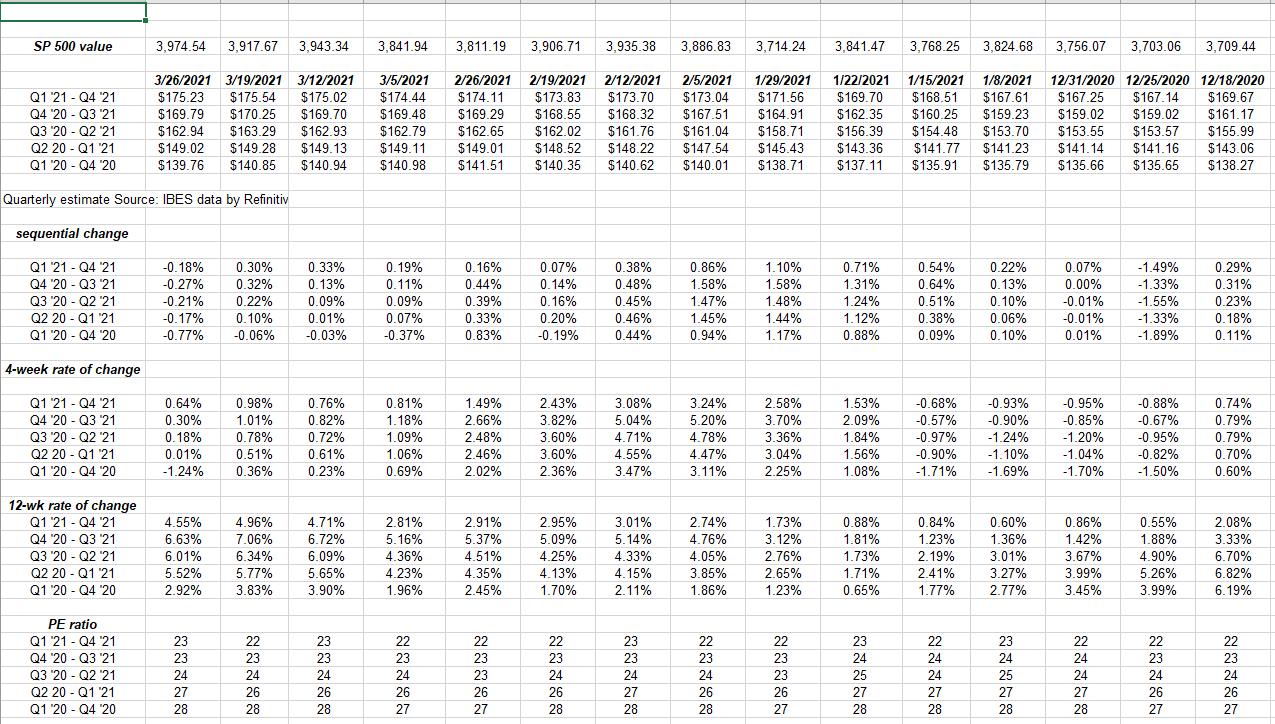
Source data: IBES data by Refinitiv
As readers should note, the “sequential change” in the SP 500 EPS estimates are starting to turn negative, which shouldn’t alarm readers since if you look at the December ’20 data attached (further right columns of spreadsheet), the last two weeks of every quarter and the first two weeks of the new quarter usually see slower revision activity and the estimates tend to be lower.
The point being that sequentially lower EPS estimate revisions can be an important lead indicator of earnings, except when the lower revisions occur very late in the current quarter or the first two weeks of the new quarter.
Here’s a way to verify or support the “rate of change” analysis:
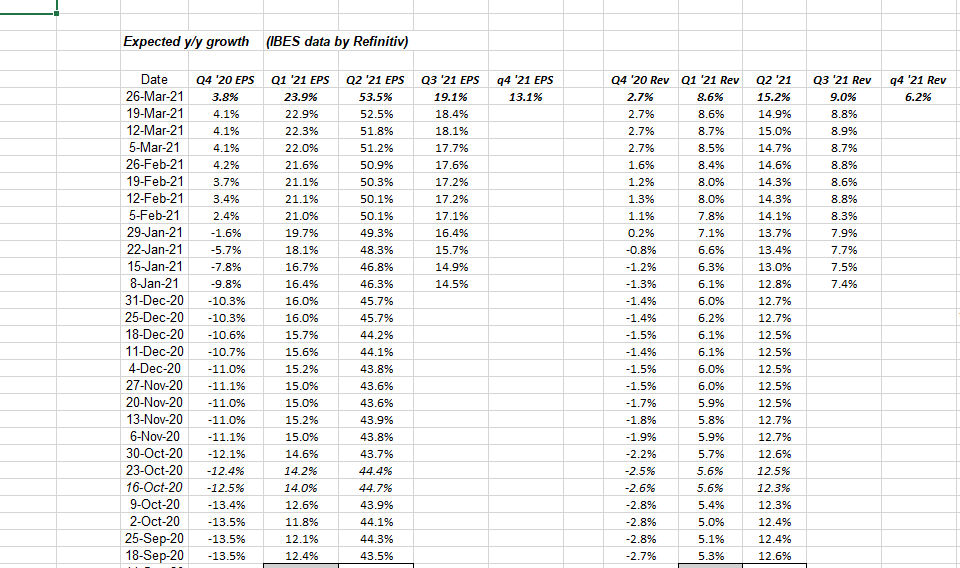
Next week, Q4 ’20 data will drop off and Q4 ’21 will be added to the above spreadsheet.
As readers can see, the expected EPS growth rates for 2021 and the Q2 and Q3 ’21 revenue growth rates ticked up or were revised higher again this week, which is good evidence that the “rate of change” data above like December ’20 is more “seasonal” and not cyclical or fundamental.
This is in fact nothing new, if you’re a regular reader of this blog.
Hope that makes sense.
SP 500 EPS data (by the numbers):
- The forward 4-quarter estimate fell slightly this week to $175.23 from $175.60, and versus 12/31/20’s $159.02.
- The PE ratio given this week’s 1.25% SP 500 rally rose to 23x from last week’s 22x;
- The SP 500 “earnings yield” fell to 4.41% from last week’s 4.48%;
- The “average” expected growth rate for 2020 and 2021 SP 500 EPS is now 6%;
Summary / conclusion: Micron (MU) and Walgreens (WBA) report their February quarter’s this week, and we have small longs in both stocks. The “macro” Sp 500 data posted above is not a market timing indicator and more a “coincident” indicator for the SP 500, so I’d caution readers who want to use the forward estimates or the forward curve, or even the published growth rates as a “timing” tool.
I’ve been working to refine the earnings data as a timing tool over the years but alone it’s not sufficient since analysts are as human as everybody else.
The conservative EPS and revenue estimates for Q2, Q3 and Q4 ’20 and the subsequent “upside surprises” for SP 500 the last 3 quarters have been historic, and are still indicative of an analyst community that has been cowed since 2008, when the “forward 4-quarter” SP 500 estimate” only started to roll over in late July, 2008.
Retail investor sentiment is finally bullish, in fact too bullish, but the sell-side estimates have been far too conservative since April, 2020.
Hope this helps.
Thanks for reading.