At least unofficially anyway, Q4 ’20’s earnings season is now over, with Walmart’s release of their fiscal Q4 ’21 earnings last Thursday morning.
400 of the SP 500 have now reported Q4 ’20 earnings per IBES data by Refinitiv.
Looking at the quarterly “bottom-up” data, Q4 ’20’s SP 500 EPS estimate is now $42.56. This same estimate on 12/31/20 was $36.88 for a 4th quarter, 2020, “upside surprise” of 15.4%.
Here is the 2020 history of “upside surprises” for the SP 500 EPS:
- q4 ’20: +15.4% ( as of 2/19/21)
- Q3 ’20: +19.6%
- Q2 ’20: +22.9%
- Q1 ’20: +2.6%
The typical upside surprise is usually anywhere between +2% and +5%.
I’ll say it again just to emphasize: the Street (i.e. sell-side analysts) dramatically underestimated the ability of American companies to generate EPS and revenue growth with the pandemic.
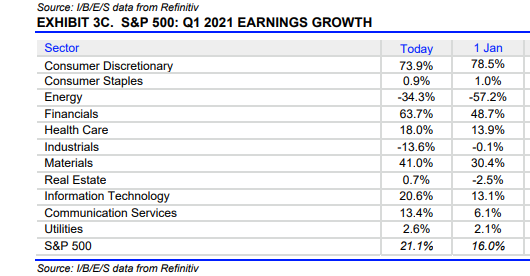
How has Q1 ’21 SP 500 sector growth rates changed since Jan 1 ’21 ?
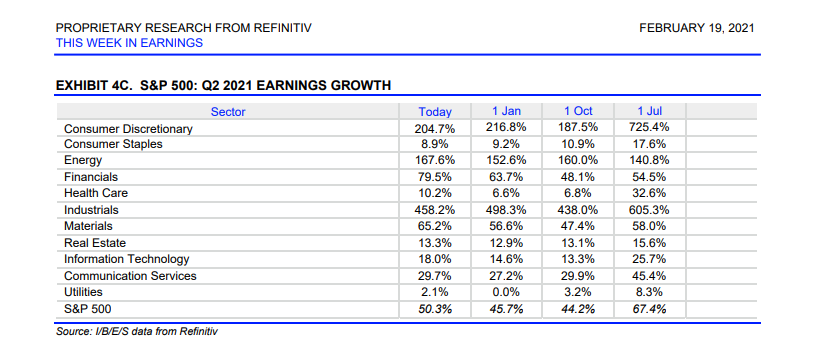
Just for grins, here is Q2 ’20 too:
The key takeaway for readers is that in “normal” years, the trend is typically negative revisions the last 90 days prior to a quarter’s earnings release and then the numbers typically get taken higher after seeing actual results.
It’s a net positive for the SP 500 that we are seeing higher EPS revisions today in terms of expected y/y SP 500 EPS growth prior to the quarter.
The fact that Q1 ’21’s “expected” SP 500 EPS growth has risen to +21.1% from +16% as of Jan 1 ’21, and that for Q2 ’21, “expected” SP 500 EPS growth has risen from 45.7% to 50.3% is a plus for the overall market.
It’s telling us sell-side analysts are pulling numbers higher as the quarter draws closer.
SP 500 Weekly data:
- The forward 4-quarter estimate rose to $173.68 this week, from last week’s $173.65, and versus 12/31/20’s $159.02.
- The PE ratio on the forward estimate this week is 22.5x
- The SP 500 earnings yield is 4.45% vs 4.42% last week and versus 4.23% on 12/31/20
- The “average, expected” SP 500 EPS growth for calendar 2020 and 2021 is 5%.
The “rate-of-change” data:
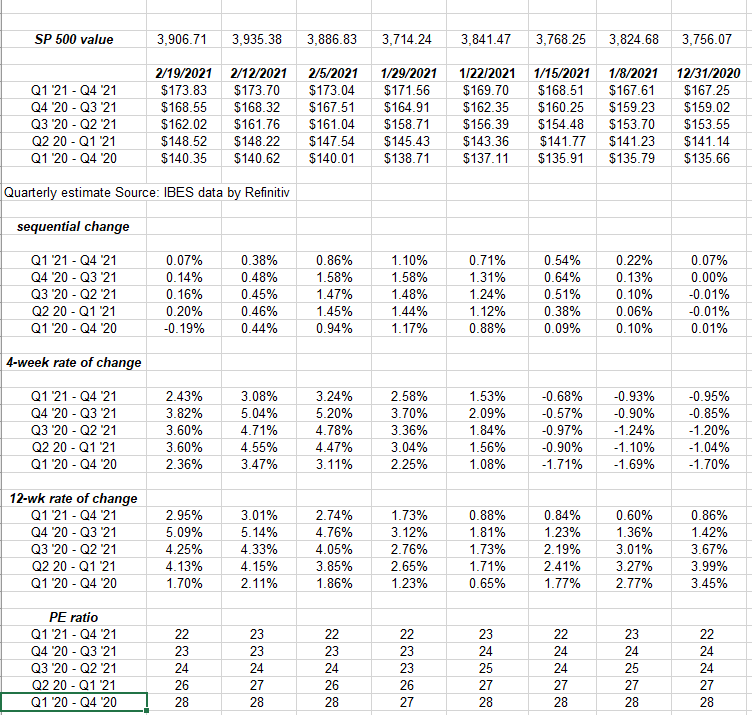
Tracking a forward SP 500 EPS curve using the IBES data by Refinitiv, readers can see how the 4-week and 12-week rate of change continue to show decent strength.
The bottom-up quarterly estimates won’t start for 2022 until late March, early April. ’21 so we are still fling blind in terms of how the sell-side strategists and bottom-up analysts see the 4 quarters of 2022.
Summary / conclusion: The fact that January ’21’s SP 500 return was negative, tells me that the calendar year has the potential to be negative as well. As always is the case, sometimes you get a false signal. Strategist’s like Tom Lee at @Fundstrat are still bullish on the year, and Tom is quite good and notoriously right, typically.
There is nothing in the SP 500 EPS forecasts yet that indicate a problem, but readers will see it in the market correction first typically before the numbers. The above SP 500 EPS data is NOT a market-timing tool. If anything the EPS data is a “coincident” indicator, with a leading aspect to the data.
As always, take everything you read with a healthy skepticism, and invest based on your own financial risk and emotional profile.
Thanks for reading.