Although the speculative fever isn’t there like the late 1990’s, the fact is the “average, annual” returns of Emerging Markets and non-US investing have lagged that of the SP 500 and large-cap growth for many years now.
This blog has written about Emerging Markets and non-US many times over the last few years, albeit being early and wrong on the timing.
Updating readers every six weeks on our “style-box analysis” this weekend, the seminal shift in returns on out-of-favor asset classes which began last fall continues.
The weekly SP 500 earnings update from this weekend, shows positive revisions for forward quarters, for the SP 500, even though the largest SP 500 names have been stuck in a trading range for almost 6 months.
Three charts from Bespoke:
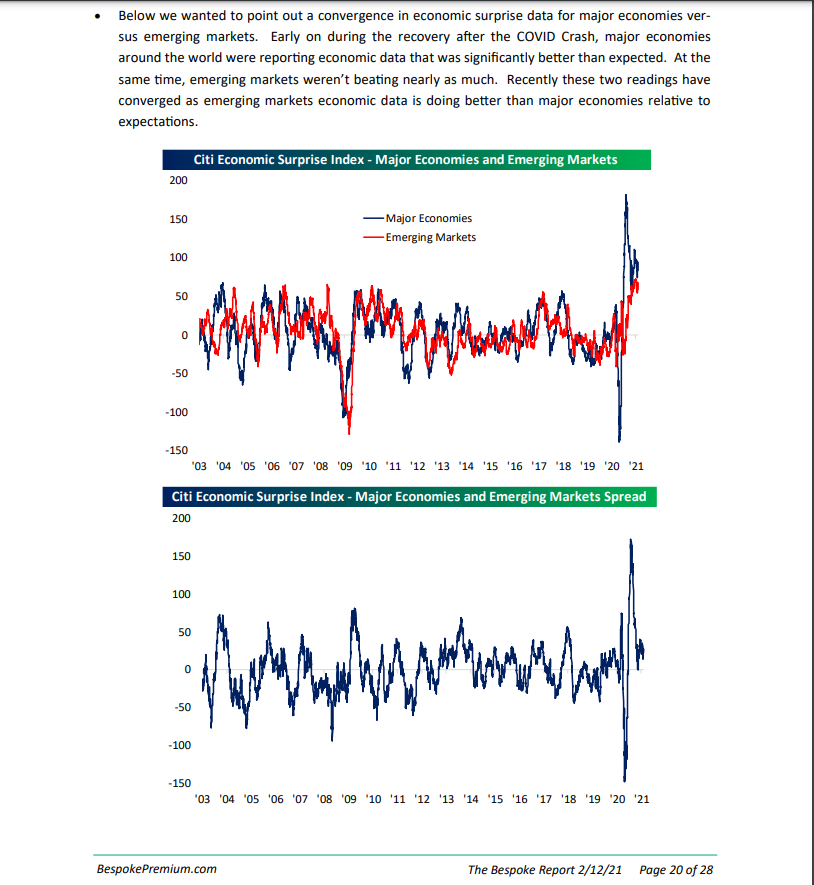
Source: Weekly Bespoke Report 2/13/21
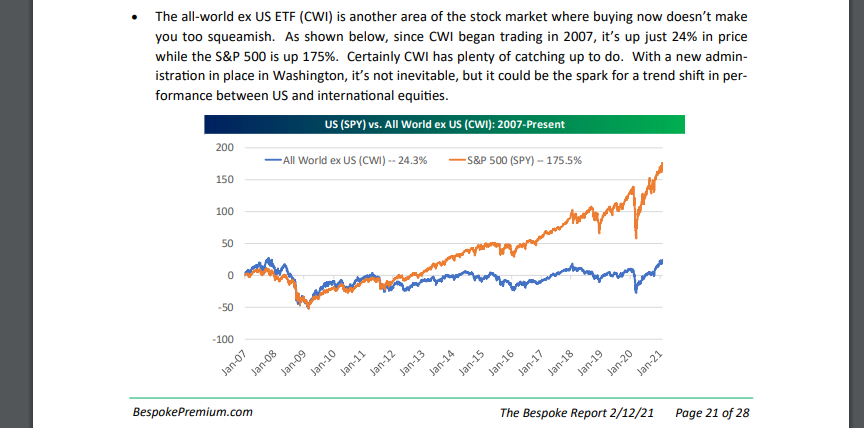
Source: Weekly Bespoke Report 2/13/21
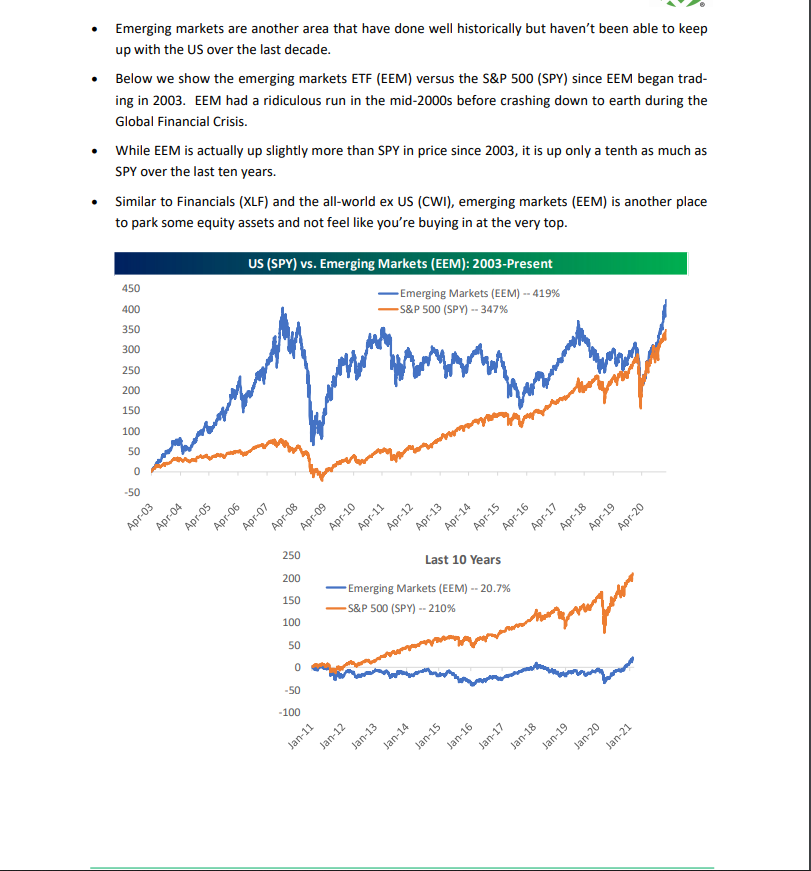
Source: Weekly Bespoke Report 2/13/21
Note the “economic surprise” index in the top chart showing EM economies doing better than developed economies relative to expectations.
The there charts from Bespoke above tell the very interesting story about SP 500 vs EM and non-US returns. While this blog uses Bespoke work quite a bit, I can honestly say if my little advisory practice struggled, there is no question my last dollar of firm spending would be spent on the Bespoke subscription. Bespoke’s work just seems to add quite a bit of value to what is done for clients.
Here are two earlier posts from this blog (November 22nd and November 8th) on US vs non-US returns over long time horizons.
Readers should get the point by now.
What about the US Dollar ?
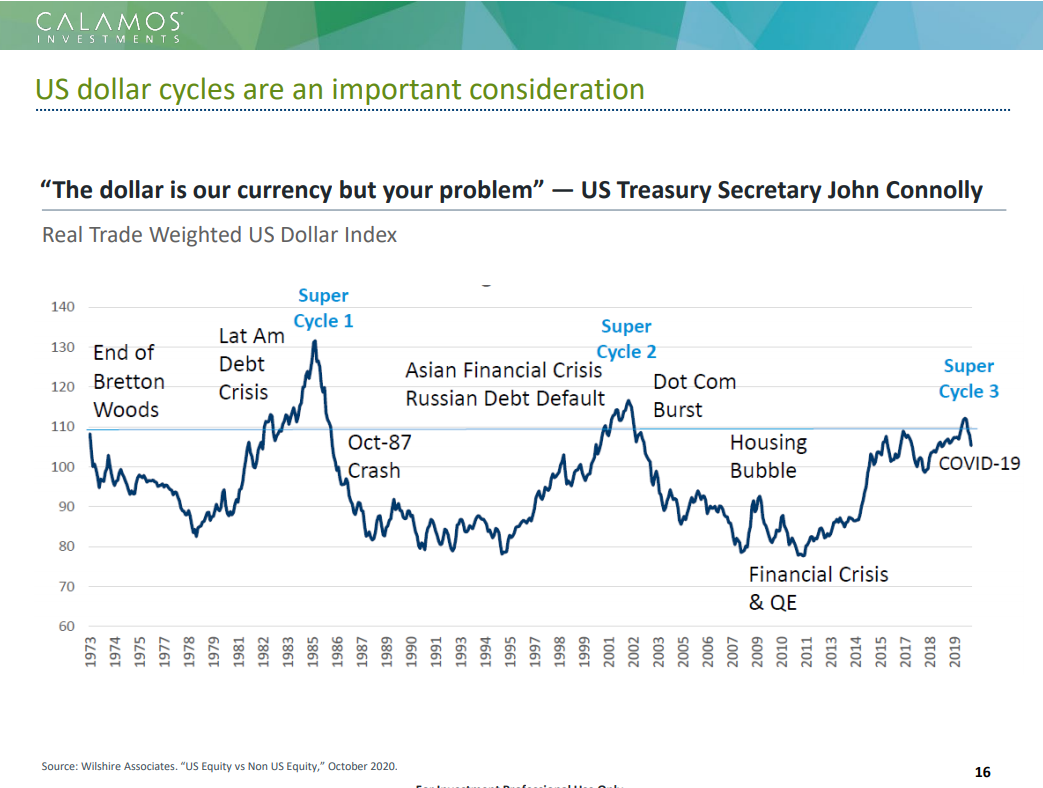
Calamos Investments here in suburban Chicago did an Emerging Markets call this week, that was quite good. Here are two charts from the Calamos presentation that should get readers attention:
Source: Calamos slide deck – Emerging Markets presentation
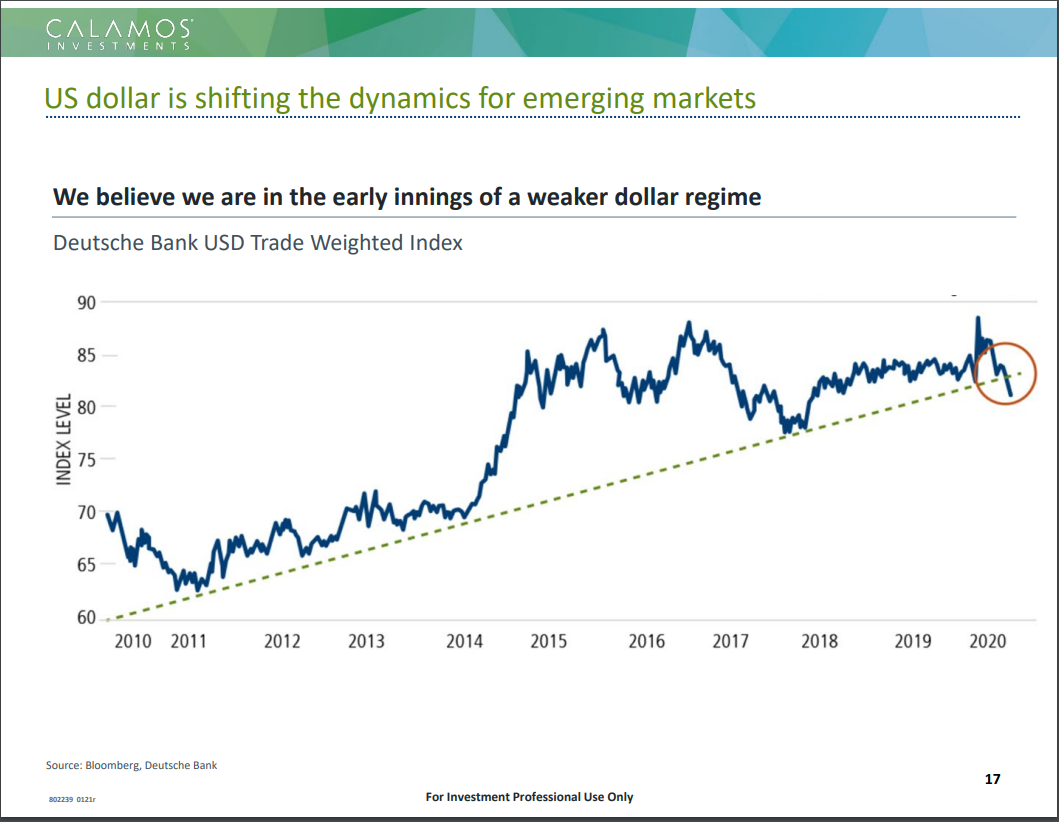
Source: Calamos slide deck
The above two slides show both the longer and shorter time frames of the trade-weighted US dollar. The 2nd chart and the recent break of the trend line portends favorably for Emerging Markets (EM) and non-US investing.
The longer-term returns on the Bespoke charts also portent favorably for EM and non-US investing.
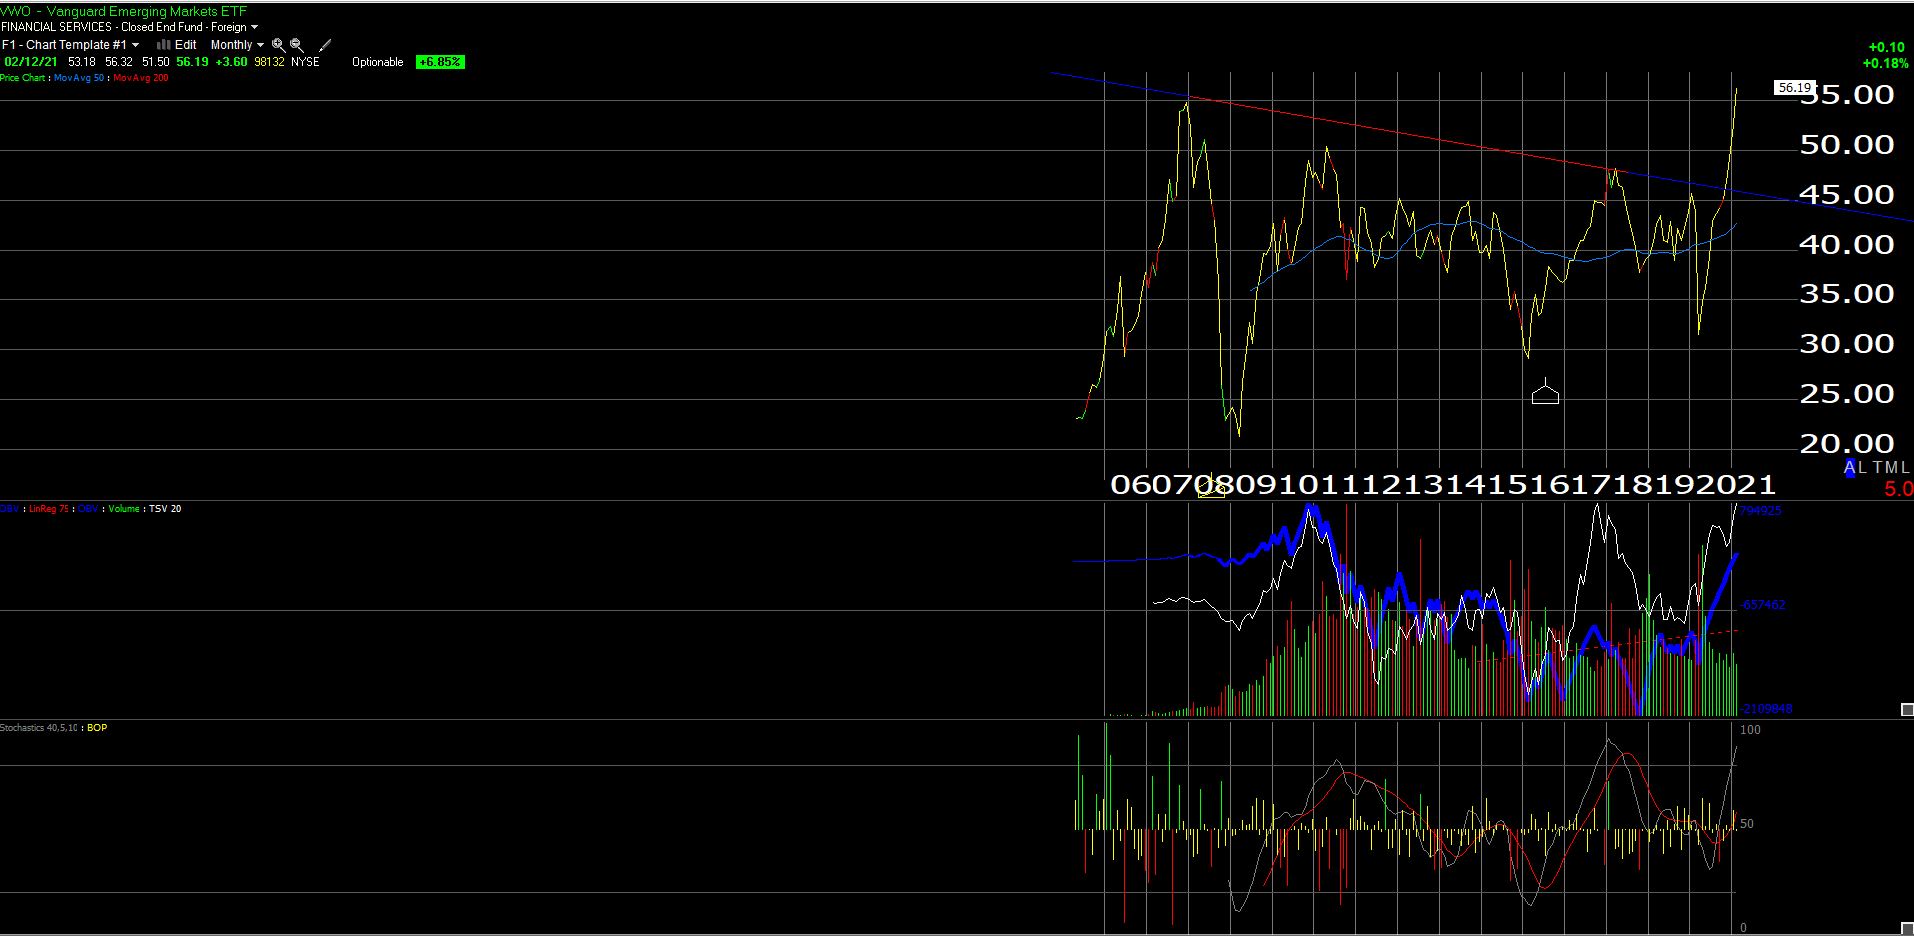
Summary / conclusion: The three primary vehicles being used within client accounts to lift the EM and non-US weighting of client equity portolios are 1.) the VWO or Vanguard Emerging Markets ETF, 2.) the Oakmark International Fund (ticker – OAKIX) managed by David Herro, with an enviable long-term track record and 3.) the VanEck Emerging Markets Fund (ticker GBFAX).
The VWO is like many EM vehicles, i.e. China-centric with largest weights in Alibaba and TenCent along with Technology (Taiwan Semi and Samsung) heavy, but the ETF is approaching it’s November, 2007 high of $57.83, which is a good sign, This ETF has been consolidating for 13 years, and if the VWO breaks above and stay above the November ’07 high, it could run for years.
Here is a monthly chart of the VWO for those readers that are curious:
 The VanEck Fund is similar to the VWO, while David Herro’s Oakmark Int’l Fund gives readers a broader depth in the Top 10 holdings, than the typical Top 10 holdings in the Emerging Markets arena. (Morningstar’s Premium subscription gives subscribers the updated holdings of most major investment vehicles in the equity markets, which is an excellent way to stay atop just what your holdings are in various securities, whether ETF’s or mutual funds.)
Client’s weighting in the above 3 vehicles has increased from 10% – 15% in early 2020 to 15% – 20% or even more since the 4th quarter of 2020.
This doesn’t mean it’s right for everybody. Take all commentary with a healthy skepticism, and evaluate all investment decisions in light of your own financial profile and emotional composition.
Thanks for reading.