It’s always tough to find a title for this blog post every 6 weeks since there are many ways to describe the various equity asset-class return distributions.
Small-caps are outperforming and have outperformed on an absolute basis since last fall, really around November 1, 2020, while “growth” is still slightly outperforming “value” in terms of the large-cap, mid-cap, small-cap asset classes.
For large-cap growth, the big date last fall was September 2nd, 2020, when many of the mega-cap stocks peaked like Apple, Amazon, Microsoft, Google. etc., although Microsoft and Google have gone on to make new all-time-highs. (Long all of the above mentioned and see more detail below.)
When discussing 2020 index returns with clients at performance meetings in January, February, ’21, what struck me was the disparity between the Russell 1000 Growth index return of 20.32%, and the Russell 1000 Value index return of 1.92%.
“Value” has not returned with the robustness of market cap laggards like the small and mid-cap asset classes.
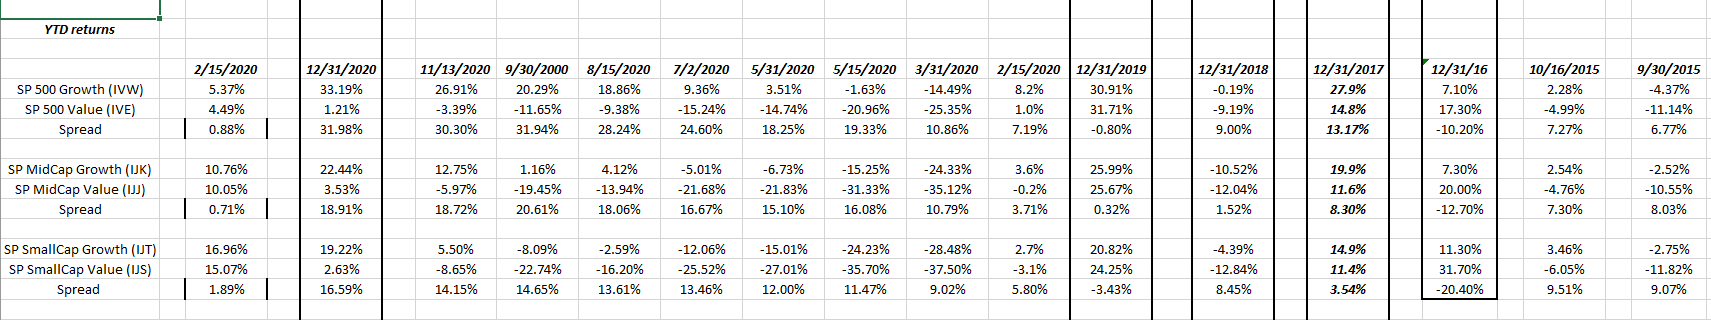
Source: Internal style-box spreadsheet w/ returns sourced from Morningstar
2020 returns were left on the spreadsheet for readers to peruse, particularly the total returns of the SP 500 Mid-Cap, and Russell 2000. Note the improvement from 9/30/20 to mid-November, 2020.
After the low in March, 2020, around March 23rd for the SP 500, the mega-caps soared through early September, ’20 outperforming everything, and then the mid and small-caps took off in early November ’20 along with international and emerging-markets too.
The quote I’m using most in client meetings in terms of the return disparities in 2020 is the action in David Herro’s Oakmark International: the fund was down 22% YTD as of Friday, October 30. 2020 only to end 2020 +4.9% for the calendar according to Morningstar return data.
That is quite a turnaround.
The spreadsheet is typically updated every 6 weeks.
Here’s the mega-cap price peaks from Sept 2nd and today’s price:
- Apple: $137.98 on 9/2/20, closing at $135.37 last Friday;
- MSFT: $232.86 on 9/2/20, closing at $244.99 last Friday;
- Facebook: $303.60 on 9/2/20, closing at $270.50 last Friday;
- AMZN: $3,552,25 on 9/2/20, closing at $3,277.71 last Friday;
- GOOGL: $1,7226.10, closing at $2,095.03 last Friday.
Those top 5 names are now 22% of the market cap of the SP 500 as of 2/12/2021.
One note of caution:
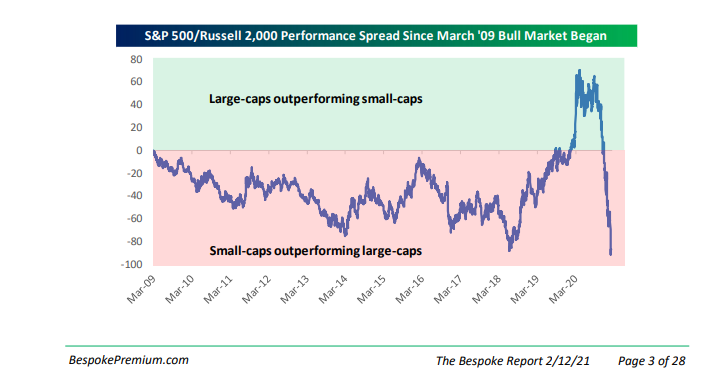
This graph from this weekend’s Bespoke Report shows the relative outperformance of the Russell 2000 vs the SP 500.
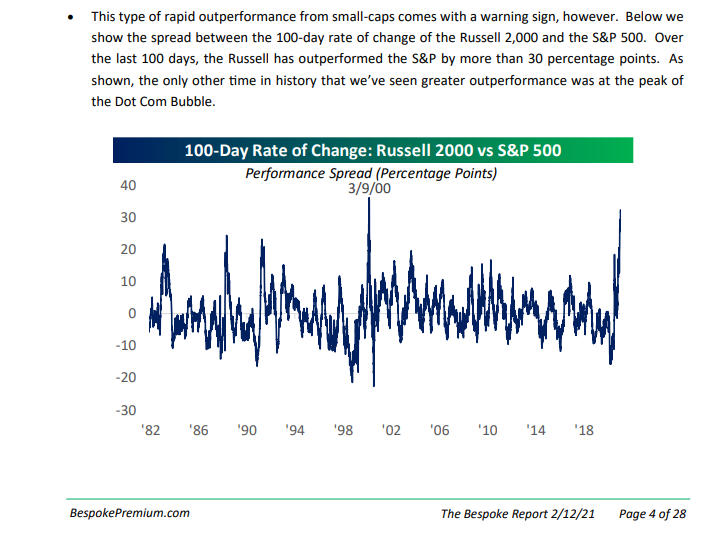
For readers that are thinking of rushing into the Russell 2000 this chart will hopefully temper that enthusiasm. Let the small-cap’s cool a bit and allocate money slowly rather than quickly.
Summary / conclusion: “Value” has gotten trashed the last few years as has anything not large-cap, but value investing has been particularly hurt by the price compression in the Financial and Energy sectors. Financial’s were 15% – 18% of the SP 500 market cap when Real Estate was spun out of the SP 500, and that percentage has dwindled to 10% as of the end of 2020. Basically thanks to low interest rates and regulation, the financial sector’s market cap weight has been cut in half the last 10 years.
Energy was 15% of the SP 500 when crude oil was near $100 per barrel in mid-2014, only to see energy’s SP 500 market cap weight fall to 3% by the end of 2020.
I’m a bigger believer in financial’s market cap weighting expanding in the next few years more so than Energy. Electric vehicles will eventually decimate the demand for gasoline and per the IEA (International Energy Agency), about half of US crude oil demand is driven by gasoline distillation.
The point of today’s blog post is that gradually the market returns are slowly moving away from the large-cap growth concentration that has been prevalent since 2016 – 2017. Small-cap, mid-cap, “value investing” and international are starting to generate “alpha” relative to the SP 500 benchmark returns.
Play the longer game with your investment portfolio. Entire asset classes can represent “value” simply because momentum has out-performed for so long.
Vitaliy Katsenelson wrote an article recently that sums up the sentiment well. Anyone who lived through the 2000 – 2002 period following the late 1990’s knows the pattern. Bruce Lee summed it up perfectly with his martial arts background that fits perfectly in the investment world, “the best style is no style”.
Take everything you read on any blog with a healthy skepticism. Invest only in a manner in which you are comfortable and that fits with your financial and emotional compositions.
Thanks for reading.