In the Friday night, January 29th, Weekly Earnings Update, Jim “Revshark” Deporre was quoted. Rev shared a Tweet from data analytics company noting unrealized gains and losses at hedge funds currently, and I wondered if this represented potential “systemic risk” for the markets and financial system.
Jeff Miller addressed the question in his A Dash of Insight blog post Saturday night, and there is probably very little around the Gamestop )GME) activity that represents systemic risk, due to the lack of leverage (which are my words, gleaned from Jeff’s post. )
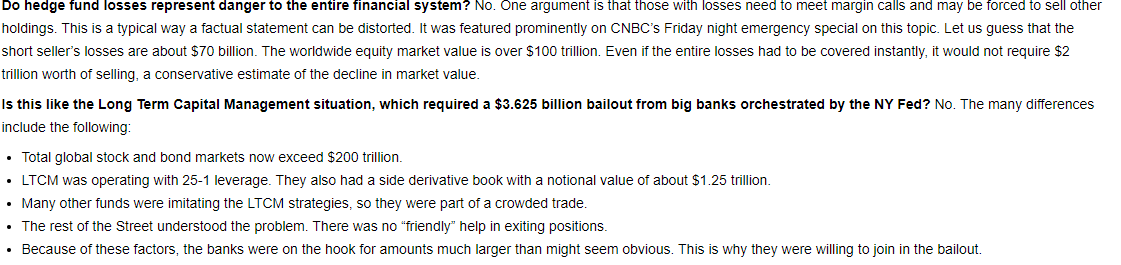
This quote from Jeff Miller’s blog post linked above covers the systemic risk issue and LT Capital comparison.
So Where are We in the Secular Bull Market ?
Whenever I talk “secular bull markets” with clients, the inevitable question arises, “So when is the end ?” which is kind of like asking your Doc, “So, when am I going to die ?”
You just don’t know.
The history of the post WW II bull and bear markets by length:
- 1945 – 1965: 20 years of a solid bull market;
- 1966 to 1980 – 15 years of a flat market with the ’73 – ’74 bear market in there, which was a 50% correction;
- 1982 to 2000 – most of us were around for that moonshot;
- 2000 to 2009 – one painful decade of stock returns, the worst decade for the SP 500 return since the 1930’s;
- 2010 to present – pretty good 10 years of returns, which have been “average” to “slightly average” over that time.
The question is then, when did the current bull market begin ? On March 9, 2009, or in late March, early April, 2013, when the SP 500 finally (!) surpassed the March, 2000 and October, 2007, when the SP 500 traded above 1,575 for good.
If you start the current bull in March ’09, the rally has been ongoing for 11.5 years. If the current bull is started when the old bull market’s highs are traded above for good, the current bull market is a little less than 8 years old.
If most secular bull markets last 15 – 20, then this bull market is 50% – 75% complete.
All this math and duration of bull markets is somewhat conjecture and somewhat educated guessing. It’s looking at history and drawing conclusions about the future path of the stock market based on that history, which may or may not be repeated.
But readers do need to be aware that secular bull markets end and readers could see flat prices or modest to negative returns for a decade or so.
The more interesting part is that – usually at the end of the bull market – is when returns go parabolic, the late 90’s being the best example.
Summary / conclusion: This post tonight is just some topics that I’ve been thinking about this weekend and of late. The poor reaction to last week’s Tech earnings is not a good sign. Microsoft’s EPS and revenue estimates were updated this Sunday, Jan 31, 2021 and the upward revisions were substantial, but the stock is still range-bound.
According to YCharts data, the SP 500 cumulative total return the last two years – 2019 and 2020 – is 55.7% and the Nasdaq 100 is 106%.
Don’t be surprised if 2021 isn’t a “shoot the lights out” year.
Take anything you read anywhere with a grain of salt and evaluate any comments in light of your own financial situation.
Thanks for reading.