In the SP 500 Earnings Update Friday night, while talking about Financial stocks reporting this week, a few important tables and charts were left off:
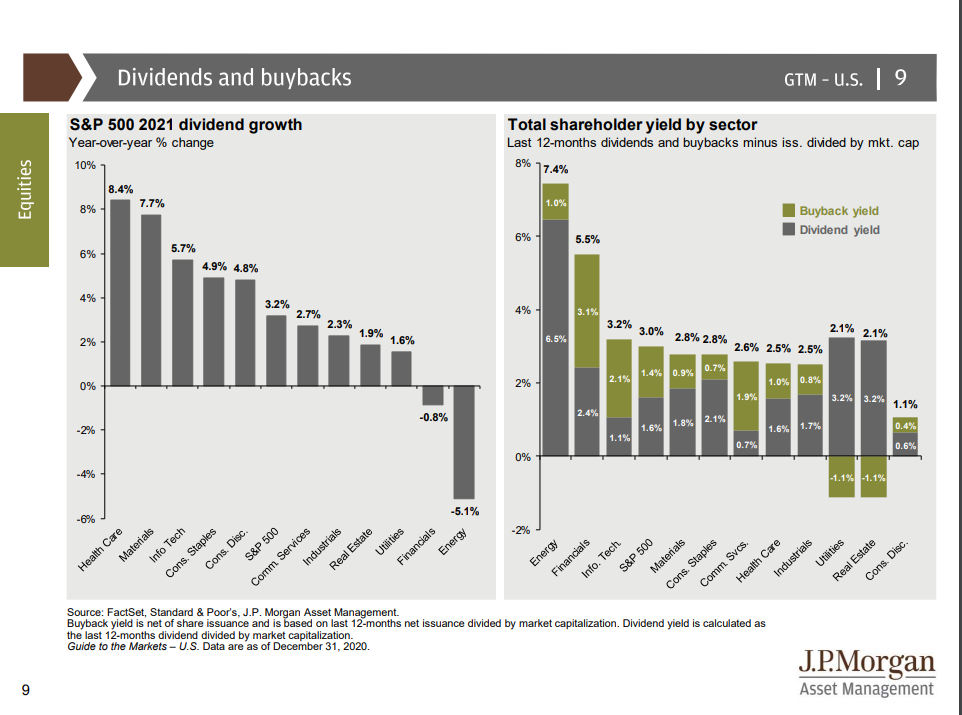
This table from JP Morgan’s latest “Guide to the Markets” shows that Energy has replaced Financials as the sector with the highest “shareholder yield” for investors. The rally in Financial stocks has lowered the dividend yield of the sector, but some banks have not announced their share repurchase intent yet so, there could still be upward catalysts for EPS within Financials from buyback news.
Personally I’d still rather own Financials vs Energy. That dividend yield in the Energy sector may not hold up.
Expected EPS / revenue growth for Financial sector:
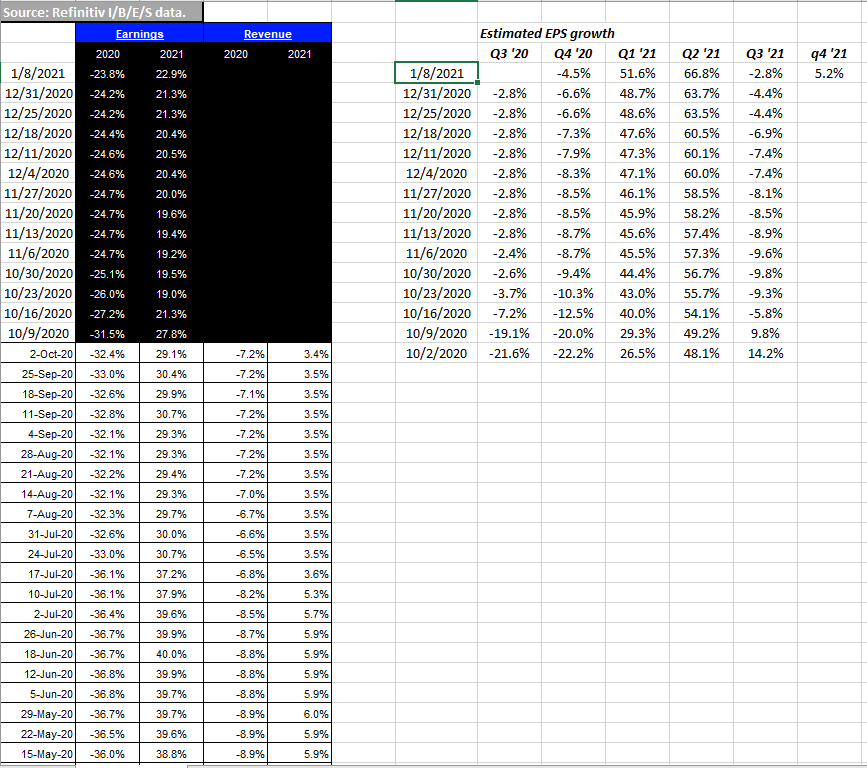
The first part of the table to the left shows expected EPS growth for the Financial sector for 2020 and 2021.
The second set of columns – also IBES by Refinitiv data – shows the quarterly data repackaged and listed chronologically so readers can see trends.
Note the trend in Q1, Q2 and Q3 ’21 EPS growth.
Also note that IBES – with the roll into the new year – is now providing expected sector growth rates for Q4 ’21.
Some of these positive revisions could be the next round of stimulus, improving loan loss provisions (LLP’s), a steeper yield curve, and even better economic growth from vaccine distribution, or some combination of all of the above.
Let’s see what happens after the Financials report this coming week.
Emerging Markets:
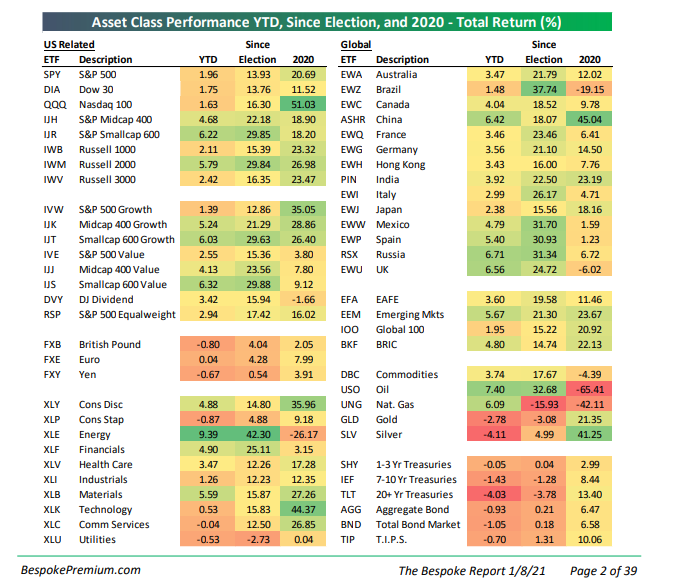
This Bespoke Asset Class Performance Matrix (ACPM) shows that as of 1/8/21, Emerging Markets have started the year with decent returns. (The single-country ETF’s and the EM returns are in the 2nd column starting at the top and then halfway down.) The EEM started the 2021 by rising 5.67% while the VWO or Vanguard Emerging Markets ETF rose 4.69%. Client’s other major non-US investment is the Oakmark International Fund, and that fund rose 3.60%, all outpacing the SP 500’s start to 2021 of +1.8%.
S&P 500 ETF: SPY performance history:
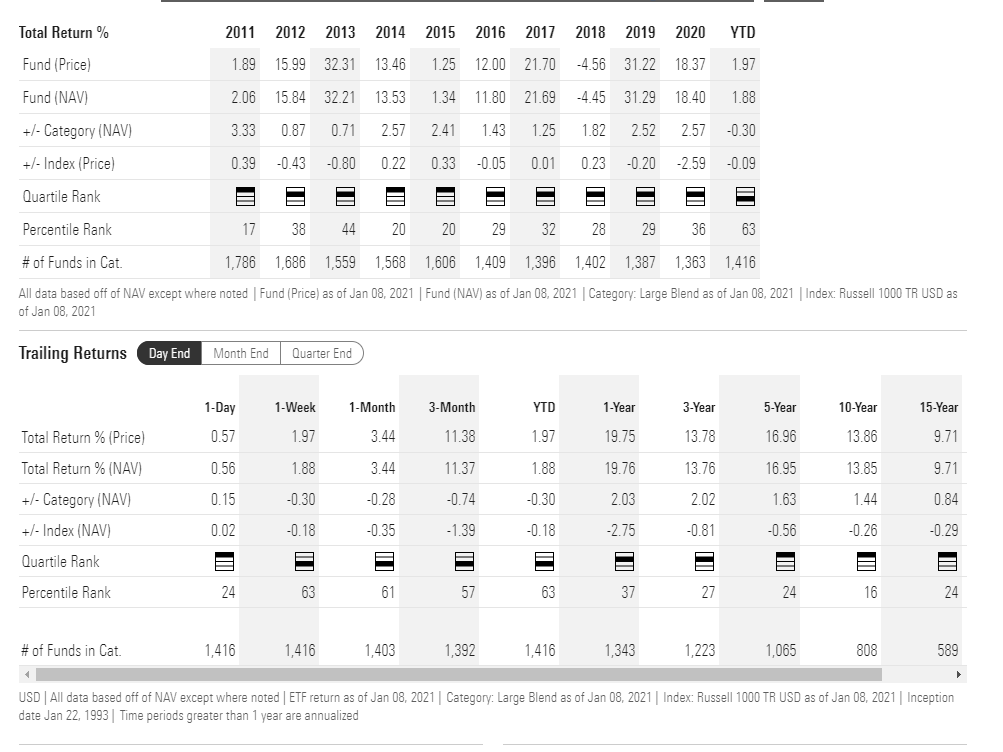
Chart source: Morningstar Premium
iShares Core MSCI EM: IEMG performance history:
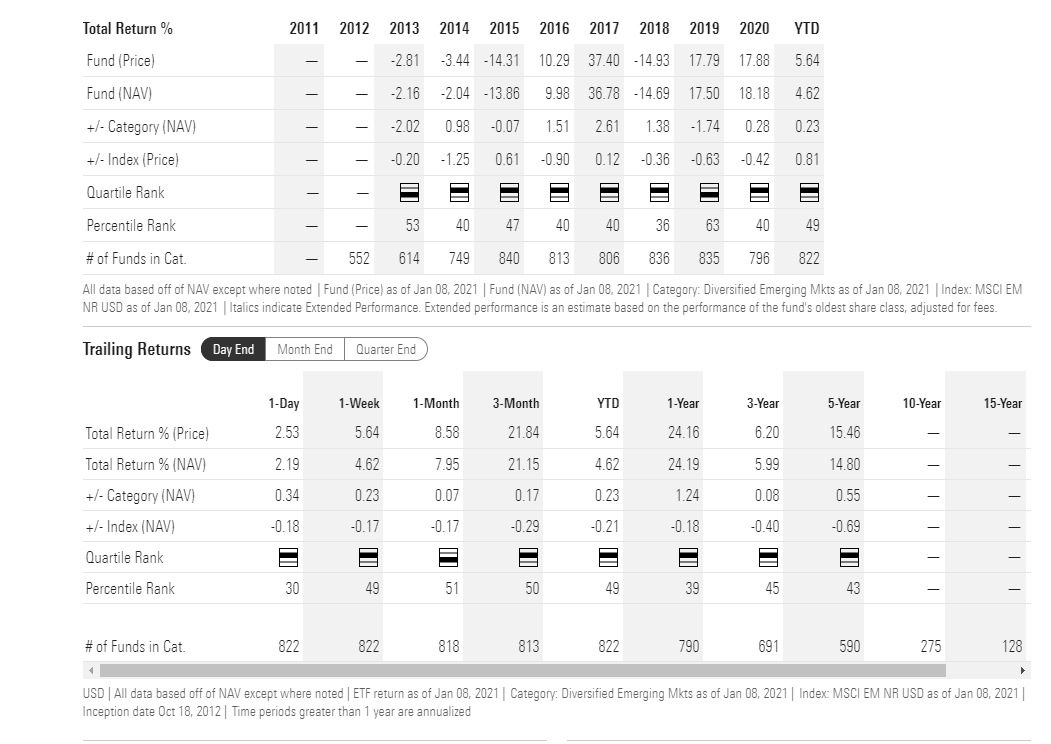
Source: Morningstar Premium
Vanguard Emerging Market ETF: VWO performance history:
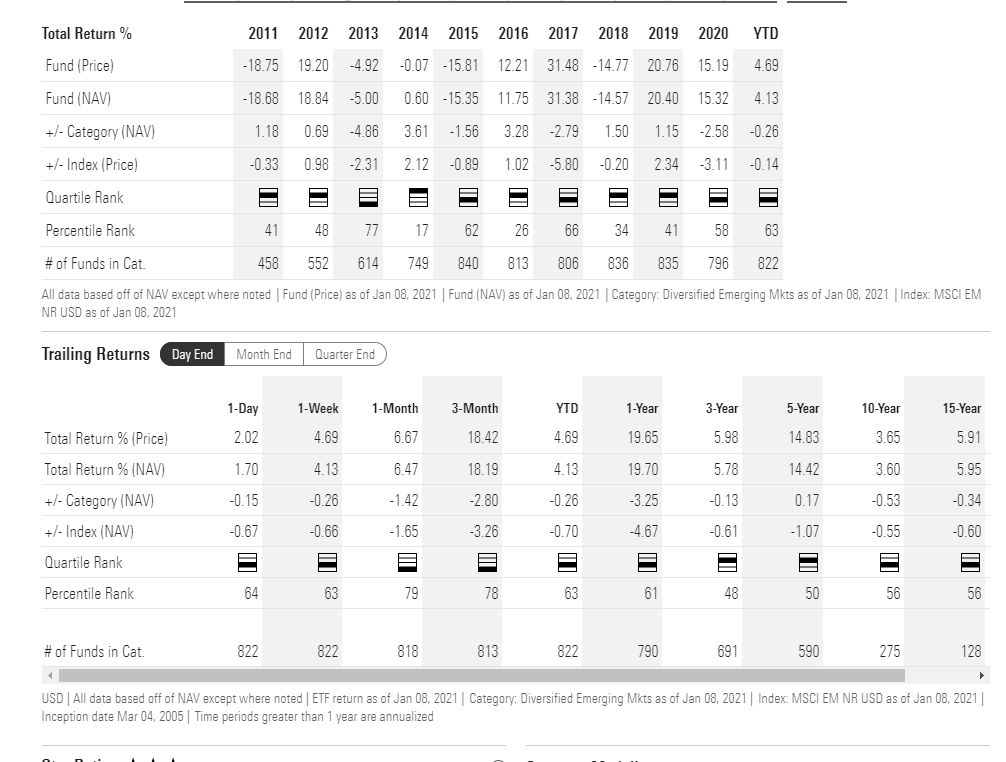
Source: Morningstar Premium
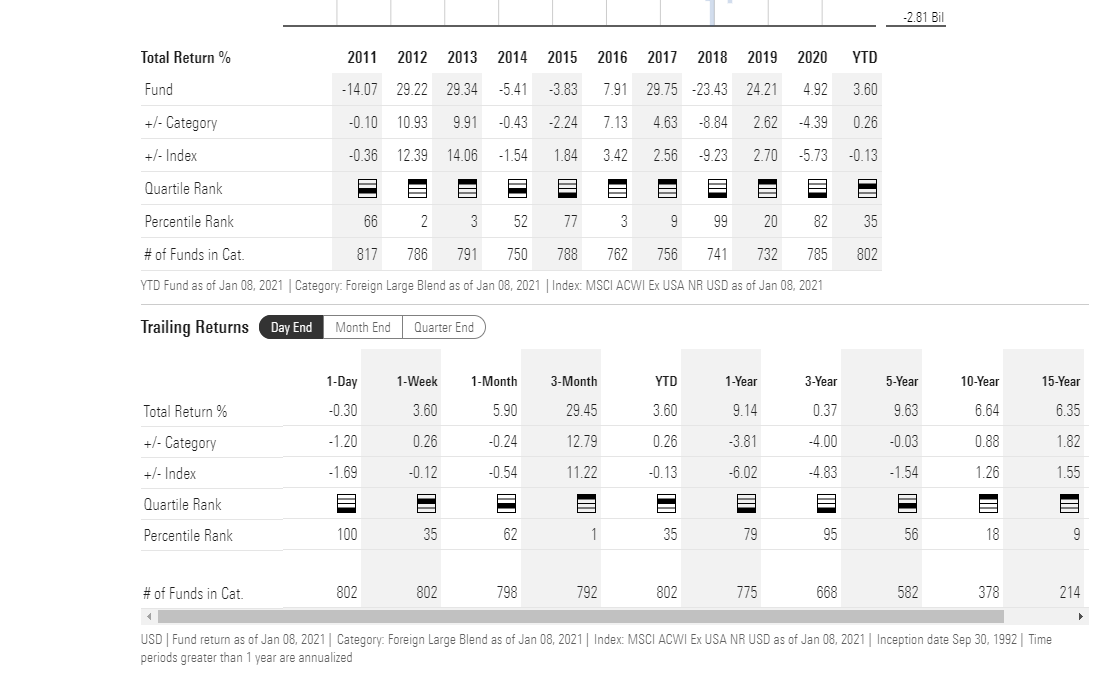
Oakmark International (OAKIX) performance history:
Summary / conclusion: To compile the above performance data into one spreadsheet, see below, but the object for readers is to show how the Non-US (International) and the Emerging Markets have lagged the SP 500 for a considerable period of time and thus – while this alone doesn’t assure outperformance – owning the VWO and the Oakmark International Fund might limit the downside if the SP 500 should see a nasty correction.
![]()
Oakmark International is particularly appealing given it’s 3-year return (just barely positive) and it’s percentile rank in the high 90’s for the 3-year period. David Herro was Morningstar’s International portfolio manager of the decade from 2000 to 2009, and has an enviable track record that is temporarily out of favor.
When the 3 and 5-year percentile rankings start to move back towards the high teens and single-digits as the 10 and 15-year rankings currently reflect, then some of the OAKIX will be sold. (The OAKIX is currently a “top 10” equity position in client accounts per the year-end update.)
Emerging Markets and Oakmark International had a remarkable turnaround in the 4th quarter of 2020. My own opinion is there is more upside for this asset class over the next 1 – 2 years. The key tell will be how the VWO / EEM / IEMG ETF’s trade on a sharp SP 500 pullback.
Thanks for reading.
The history of the EM and international was that it did little in the late 1990’s when Tech and large-cap growth were white hot (certainly there were some exceptions in terms of mutual funds and geographies), and then when the Nasdaq peaked in March, 2000, and then we saw the bottom in March, 2003 with the start of Gulf War II, EM’s commodities, gold, basically anything that didn’t work in the 1990’s had a great decade up until 2007 – 2008.
It’s probably unlikely that we would see the same degree of negative correlation that we saw from 2000 – 2009, but the SP 500 is due for a period (perhaps ?) of subpar returns and EM and Int’l for a period of stronger returns.
That’s the calculated investment probability right now.
Here is the big picture on 2021 expectations written late last year.
(Past performance is no guarantee of future results. How the dollar fares and it’s relative strength or weakness has an impact on non-US securities and asset classes. Take all of the above with substantial skepticism, and assess your own appetite for volatility and risk/reward. The capital markets can change quickly.)
Thanks for reading.