One of the spreadsheets kept since 2011 is the actual EPS and revenue growth by quarter and by sector for the SP 500.
One observation that jumped out when updating the actual Q2 ’20 growth rates today was that the SP 500 has seen very little earnings growth since 2018.
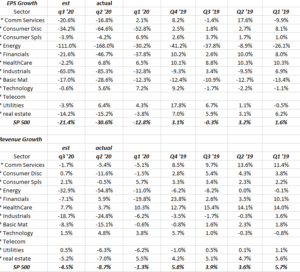
Note the overall SP 500 EPS growth rate since Q1 ’19.
One explanation could be that the tax cut really boosted 2018 earnings, thus the 2019 “compares” were much smaller.
Although 2017 SP EPS growth by quarters isn’t shown, if the average of the 15 quarters is taken – Q1 ’17 to Q3 ’20 – SP 500 EPS growth has averaged 5.5% since the start of 2017.
That’s below the long-term average of 7%.
——————————————–
Final Q2 ’20 data shows that the final bottom-up estimate for Q2 ’20 was $27.98. The estimate started the quarter at $23.16.
Here is how the expected growth rate changed for Q2 ’20 SP 500 EPS by sector:
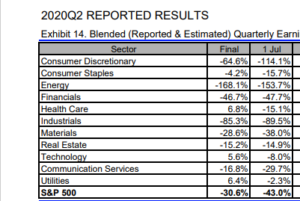
Over the last 12 weeks, the greatest rate of improvement occurred in these sectors:
- Consumer Discretionary
- Consumer Staples
- Health Care sector
- Technology
- Communication Services
These 5 sectors are 70% of the SP 500 by market cap.
———————————————
Forward 4-quarter estimate:
Since today was October 1, I thought readers would be interested in knowing that the “new” “forward 4-quarter” estimate for the SP 500 is $156.25.
Last weekend, the “forward 4-quarter estimate” for Q4 ’20 – Q3 ’21 was $156.32.
The initial q3 ’20 “bottom up estimate is $32.85. By the time e see Christmas Day, this estimate should be up near $35.
———————————————
Q3 ’20 expectations by sector
How did Street expectations for EPS growth change for Q3 ’20 as we moved through the 2nd quarter earnings ?
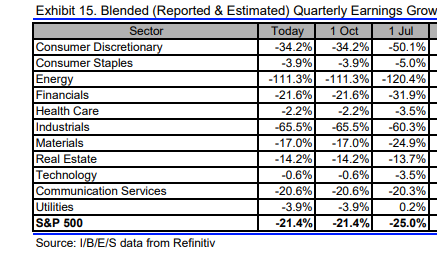
What’s interesting is that almost every sector improved in terms of “expected” EPS growth except Industrials, possibly due to airlines ?
Real estate deteriorated a little too.
The sectors with the sharpest improvement already heading into Q3 ’20 earnings are Consumer Discretionary, Financials, and Materials.
Top 10 Holdings as of 9/30/20:
- Microsoft YTD return +34%
- Amazon YTD return +70%
- BlackRock SIO (bond fund) +2.7%
- JP Morgan Income Fund +0.60%
- VWO (Vanguard Emerging Mkt ETF) -1.21%
- QQQ +31%
- Loomis Sayles Bond +3.25%
- JP Morgan -29%
- Schwab -22.7%
- Tesla +413%
The goal for clients is to not make big moves or changes. Buys and sells typically occur gradually over time. Here was the “top 10” (https://fundamentalis.com/?p=10392) at the end of last quarter.
Conclusion / Summary: This blog is being upgraded and improved and we are working on it as I am trying to write the blog posts, (this weekend too) so if anything is amiss, it’s my fault.
These quarter-end data points for the SP 500 EPS and revenue give readers some idea what to expect. The data is still pretty broad and covers a wide swath so more detailed data will come prior to earnings.
Thanks for reading.