SP 500 Earnings Update: Sequential Declines in Forward EPS
Once again, we are seeing this week sequential declines in forward EPS although the 4-week rate of change is still positive, although declining too.
This is the time in the quarter where analysts usually get nervous, and start to bring down numbers, which typically lasts from now until October 10th or so, and then once Q3 ’20 earnings start you’ll start to see upward pressure once again.
This happens every quarter: It’s the last week of the current quarter and then the first 10 days of the new quarter where analysts get antsy, and would prefer to miss an upside surprise than a downside shock.
Also, the “quarterly bump” next week, which we’ll see with Friday, October 2nd’s Refinitiv data, should come in around $156.32 versus the current SP 500 “forward 4-qtr estimate” this week of $146.27.
That’s a $10 or 6.5% increase in the forward roll from Q3 ’20 to Q2 ’21, to Q4 ’20 through Q3 ’21. (See the forward earnings curve table below for the numbers.)
The July 1 estimate from June 30 this year was a whopping 11.8% increase from $127.44 to $142.66.
The estimates reflect the recovery from the March to May ’20 economic shock.
- The SP 500 EPS forward 4-qtr estimate this week fell to $146.27 vs last week’s $146.42, only the second weekly sequential decline since July 2.
- The forward PE ratio is 22.5x
- The SP 500 earnings yield rose for the 5th straight week to 4.47%, but it still has more room to increase.
- The “average” SP 500 EPS increase for calendar ’20 and ’21 remains at 4% so SP 500 EPS growth is still expected the next two years.
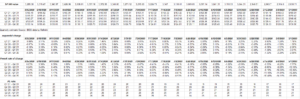
Readers should look at the data from June 26th forward in the “sequential rate of change” row to see how the numbers go negative until about July 10th,
This is a pretty consistent pattern over the years, although because this table was only created “post-pandemic” in April ’20, the back data isn’t shown.
The sequential declines in the forward SP 500 EPS curve are the first uniform sequential declines since (guess when ?) June 26th.
The investment implications are when you hear a pundit say SP 500 earnings are weakening or negative, (and thus be bearish) know that what’s happening isn’t that unusual.
Next 4 quarters EPS and Revenue Growth
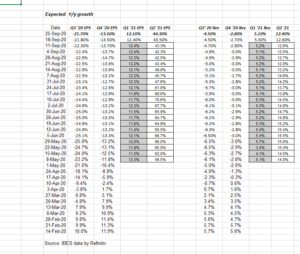
This straight IBES by Refinitiv data shows the SP 500 expected EPS and revenue growth from Q3 ’20 to Q2 ’21.
You can see how analysts have been positively revising Q3 ’20 EPS and revenue growth, but are holding serve on the rest of the quarters.
I haven’t re-worked this data at all, with the goal being for readers to see the actual expected y/y growth rates as put forth by IBES data by Refinitiv each week.
Summary / conclusion: While the frenzy around Q3 ’20 earnings will begin in the next two weeks, readers should keep your eye on the longer game, which is Q4 ’20 and early ’21 quarters, which get far less press but carry great import in terms of what happens within the SP 500 in terms of sector rotation.
Hopefully this blog will continue to provide insight for readers.
Sector data needs to be shown to readers since it provides an important perspective that is needed given the large-cap tech dominance in the market this year.
I was supposed to get it done last weekend, but promise to do so this weekend.
A meaningful fiscal stimulus package could turn the SP 500 around quickly.
Take all data included herein with substantial skepticism, since the earnings data changes every week.
Thanks for reading.