It has been a while since Ibbotson’s Stocks, Bonds, Bills and Inflation (SBBI) data had been seen, since Morningstar bought Ibbotson’s practice years ago and moved the SBBI in-house and stopped offering The Handbook to the investing public.
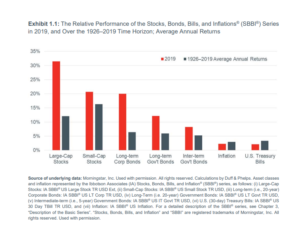
The week, the SBBI data somehow wound up attached to a CFA email, and this chart was in the first 20 pages of the 200 page data dump.
Every asset-class except Inflation and US Treasury Bills is above it’s long-term moving average.
Obviously, the US economy today is very different than what it was like in 1926. The US went from an agrarian economy in the early 1900’s to the post WW II manufacturing economy, and then tilting over to a Services economy in the 1970’s. It was the 1970’s where manufacturing fell below 50% of GDP. Today, according to the latest chart out of FRED (St Louis Fed), manufacturing is about 9% of total US GDP.
What’s more interesting is that in just the last 30 days, Jay Powell has said that the Fed will adopt a more squishy inflation target, meaning the Fed will let the inflation rate a little more than they have historically, before activating a tighter monetary policy.
Waiting for higher interest rates and inflation the last 20 years, has been the one, true “Waiting for Godot” moment as an investment advisor.
Trends can change in the market when you least expect them. I remember thinking – after the fact – to have appeared on CNBC in March, 2000, and to to say to the world you were selling all your tech and and buying gold, would have only meant you were laughed off the set.
————–
https://www.bloomberg.com/news/articles/2020-09-02/jpmorgan-says-key-markets-are-pricing-in-contested-election-risk
Here is a link to a JP Morgan story on the chance for an election-related event around the Presidential election.
A client actually called me on this – he said his 401k provider actually froze his 401k plan on this risk. I told the client i’d never heard of a 3rd party administrator doing that, but the client may not have understood it entirely.
The whole things seems kind of bizarre, and with the even so well anticipated, doesn’t that diminish the market impact ?
————–
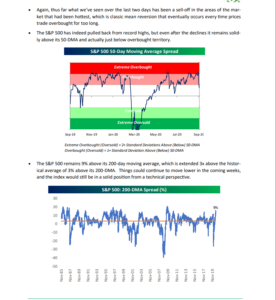
Compliments of Bespoke’s Weekly Report sent to subscribers on 9/4/20.
The selloff in Tech has taken some of the intensity out of the day-to-day trade, but the bottom chart shows the SP 500 could drop further and still be well within the range of “normal” and above the 200-day moving average.
Nothing more to add.
Have a wonderful weekend and thanks for reading.