First, a quick note of thanks to Jeff Miller, on his two articles on caution warranted on interpreting the nonfarm payroll report.
The first article – which was last weekend or August 2nd – laid the premise for how to interpret a labor report (https://www.dashofinsight.com/employment-report-preview-interpret-with-care/) and then the Friday, August 7th article by Jeff followed up on the original article by detailing the numbers (https://www.dashofinsight.com/nfp-response-rates-sound-a-warning/). Personally i never would have thought about “business deaths” or “response rates” in terms of gauging the quality of the monthly business survey. “Teach a man to fish…”
Gary Morrow and Doug McKay (This Week on Wall Street) have been looking for a rotation for a while now, as have so many others given the one way nature of the market.
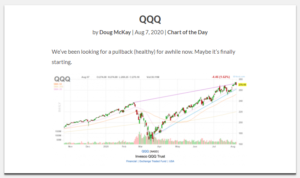
This chart posted Friday, August 7th, 2020, led McKay to think the rotation is nigh. Friday’s late trading action was somewhat unusual. large-cap tech sold off, while financial’s bounced, albeit financial’s bounced on light volume.
Berkshire reported results Saturday, February 8th, 2020 and it showed Mr. Buffett buying back $3 – $5 billion in stock. Berkshire isn’t subject to CCAR apparently (like the major banks) so Mr. Buffett is taking advantage of the excess capital and putting it to work buying his shares.
These guys are very good technicians. Be sure and give Morrow a follow on Twitter (@garysmorrow) and McKay on the blog. (www.thisweekonwallstreetcom).
One thing i liked about McKay’s comments was that he thought a correction in the Q’s would be “healthy”. The Nasdaq Composite corrected 80% between March, 2000, and July, 2002. I doubt anyone is looking for that level of drawdown again – even for the mega-cap giants – thus owning the giants doesn’t have to be a “binary” decision, i.e. completely in or out.
Other charts on the prospects for “rotation”:
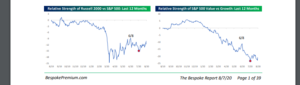
The relative strength of the Russell 2000 and the “value” style over the last 12 months is well known.
Both are trying to stem the under-performance vis-a-vis large cap growth since June ’20.
Clients now own some RSP (SP 500 equal weight ETF), the QQQE (Nasdaq 100 equal weight ETF), some small-cap Russell 2000 funds directly, some IWM, and some MDY (mid-cap ETF).
However wholesale changes away from large-cap and growth has not yet happened. Head fakes in the market happen all the time. I’m more interested in offsetting technology with financials to keep the balance between value and growth.
Found on Jeff Miller’s blog, i had forgotten about this interview Tom Lee did on CNBC this past week. Tom is very good, and very forthright about his opinions. If he’s right, readers want to watch the market leadership. Tom’s bullish opinion implies that the technology Big 5 leadership likely continues, if he is right.
Corporate credit spreads:
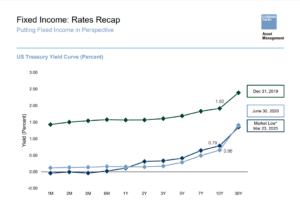
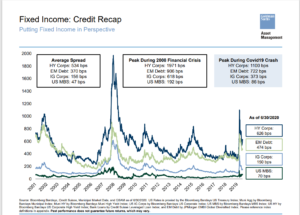
The top slide from a Goldman Sachs credit call on Friday, August 7th, shows the change in the Treasury curve over the last 8 months, while the 2nd slide showed the change in high-yield and investment-grade corporates, as well as EM (emerging market) debt and MBS (mortgage-backed securities).
While the latest spreads were only as of June 30th, 2020, on the Goldman slide, and have continued to improve since, EM, corporate and high-yield credit continue to offer decent relative value in my opinion, at least for the next few months.
Client weights and allocations are being thought of in terms of “pre” and “post” election postures. Clients remain tactically overweight high-yield and corporate credit risk and have been since April ’20 at least until early Fall’20 and early November ’20.
Corporate credit risk has added nicely to client accounts since the March 23rd SP 500 low.
Don’t Forget Short-term High Yield ETF’s
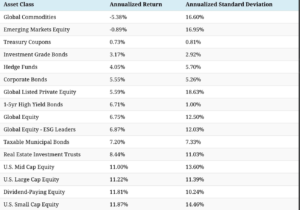
This table was posted to Twitter by LizAnn Sonders on July 9th. It was buried in twitter bookmarks while working on something else.
Note the “average, annual return” and then standard deviation, for short-term high-yield bonds.
Needless to say clients are long the SHYG, although the SJNK probably works just as well.
Sharpe ratio fans would be quite proud.
Didn’t get to everything I’d hoped to since another few articles are in the hopper over at Seeking Alpha.
Thanks for reading, and as always take everything you read on any blog with great skepticism (especially this one), do your own homework, and evaluate all opinions in light of your own financial conditions and profile.
Markets change quickly and change direction suddenly with little notice.