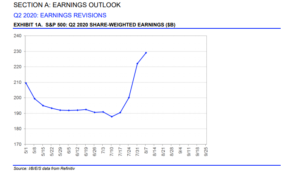
This is a graph found on the first page of “This Week in Earnings” from Refinitiv, and it shows the Q2 ’20 bottom-up quarterly estimate bottoming on July 10, and moving sharply higher since. They say a picture is worth a thousand words, well, that’s a good picture of what Q2 ’20 earnings look like.
Here is the same data from a y/y growth perspective:
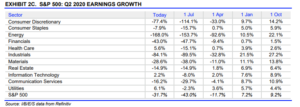
Note the improvements in the following sectors (by alphabetical order):
- Consumer Discretionary: Amazon and Tesla surely helped the improvement from July 1 ’20;
- Consumer Staples: PG’s great quarter helped no doubt. PG, Pepsi, Coke, and Walmart are almost 50% of the Consumer Staples ETF, XLP.
- Health Care: Note Health Care’s improvement from July 1 through August 7th. That’s -15.1% expected on July 1 to today’s actual / expected growth rate of +5.6%.
- Technology: No surprise here but Tech’s 1,000 bp swing in expected EPS growth was still less than Health Care’s 2000 bp swing.
These 4 sectors comprise 60.4% of the SP 500 market cap:
- Technology: 28%
- Cons Disc: 11.2%
- Cons Spls: 6.9%
- Health Care: 14.3%
Here’s a look at the usual SP 500 earnings metrics:
- The forward 4-qtr estimate rose again to $145.92 for the 6th week in a row
- The PE is 23x that forward estimate
- The “average” growth rate of both 2020 and 2021 expected SP 500 earnings is still 4% for the 17th week in a row
- Here is one aspect to the data that worries me:
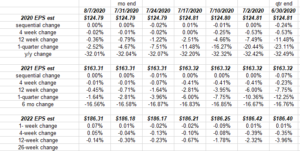
The 2020 and 2021 “annual” SP 500 EPS estimates are within $0.01 – $0.02 of their June 30 values even though the Q2 ’20 quarterly estimates have improved considerably for some sectors.
Even the 2022 SP 500 annual EPS estimate has only changed by $0.09 since June 30th.
By comparison, here is how the SP 500 Q2 ’20 quarterly bottom-up estimate has changed over the last 5 – 6 weeks:
- 8/7/20: $27.08
- 7/31/20:$24.69
- 7/24/20: $23.60
- 7/17/20: $23.02
- 7/10/20: $22.76
- 7/2/20: $23.16
- 6/30/20: $23.15
That’s a big change for a quarterly bottom-up estimate. What it could be telling us is that Street consensus isn’t changing for full-year numbers, until the sell-side consensus knows more, even though the 2nd quarter’s results – the worst in a decade – haven’t been nearly as bad as expected.
Geeky stuff, but it caught my eye.
The forward earnings curve:
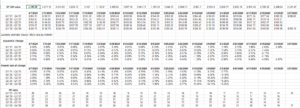
This spreadsheet shows something similar to the above: note the sequential and 4-week change to the “non-annual” buckets of the forward SP 500 earnings curve. The annual estimates aren’t changing; the non-annual buckets are showing far more dispersion.
Q3 and Q4 revenue and EPS growth rates:
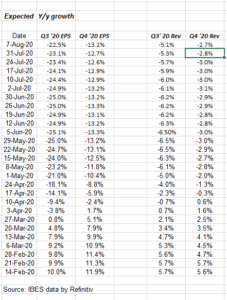
What’s being wtached or tracked week-to-week from this IBES data is the “expected” Q3 and Q4 revenue growth.
Note the steady improvement since the week of June 5th, ironically the week the SP 500 peaked for a bit.
Summary / Conclusion: So what’s it all mean ? It’s a safe bet the SP 500 has outrun the expected, underlying earnings improvement of the benchmark, but that was being said in June too. The big question that seems to be on everyone’s mind is when does the inevitable rotation occur, and we do see upside in small and mid-caps, value sectors, and possibly some movement in the Covid-19 victims like airlines, energy and such. I do think you have to take each sector and asset class on its own.
It’s no mystery that individual mega-cap stocks are having a substantial impact on the performance of the indices.
To expect an 80% correction that hit the Nasdaq Composite and the the large-cap growth rotation in 2001 and 2002 might be a little extreme though.
As the economic data is showing, we could probably expect a slow, gradual improvement in SP 500 earnings as we move through the rest of 2020. Expect for bad sentiment and good breadth, you’d have to think the SP 500 would have to – at least – tread water for a few months to allow the SP 500 earnings to catch up to prices.
Take everything you read here with substantial skepticism. Market change quickly and in directions you don’t anticipate. The SP 500 rose another 2% this week.
SP 500 earnings are still moving in the right direction.
Thanks for reading.