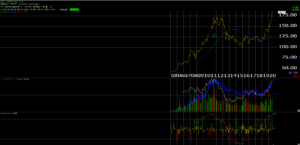
What looks like a long-term breakout on the chart is not.
The all-time-high on September 26th, 2011, was $185.85 for the GLD ETF. Today’s trade was close to $185.85 but as of 1 pm central time, it doesn’t look like the ETF will close above the all-time-high today, hence as of month-end there is no breakout (yet).
Sentiment around gold and the miners, is very bullish now, too.
Never been a gold “bug” – the Street abounds with so many theories of why gold does this or that. The dollar, inflation, deflation, money printing, US interest rates, non-US interest rates, foreign currencies, etc. etc. It never ends.
One aspect around the gold trade I clearly remember from the 1980’s and 1990’s is that the gold bugs were constantly bullish, and during one of the greatest bull markets for US equity, the price of gold fell from $800 in 1980 to $200 by late December, 1999, over an 18-year period.
A trade and close above $186 on heavy volume might get me interested in the GLD as a short-term, technical trade, nothing more. It would be a 9-year breakout on the charts, particularly if large-cap Tech and growth start to fade.
SP 500 Earnings Update:
- The forward 4-qtr estimate rose again, for the 4th straight week to $144.65 from last week’s $143.79.
- The “average” expected earnings growth for the SP 500 EPS for 2020 and 2021 remains at 4% for the 16th straight week.
- The expected 2021 SP 500 EPS estimate of $163.31 remains above the calendar year actual EPS for 2019 of $162.93.
- The SP 500 forward “earnings yield” of 4.49% remains lower than I’d like especially since forward estimates are increasing. It’s the one metric that probably indicates the SP 500 could use a good flush. The SP 500 earnings yield peaked the week of Christmas, 2018, at or above 7% just as Jay Powell was turning from a monetary hawk to a dove, and then slipped down to the low 5% range in late December ’19. Was it a warning sign for Covid-19 ? Doubtful. Covid-19 was not yet anywhere close to a top media story.
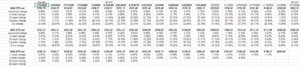
Here is a part of the SP 500 earnings spreadsheet (data source: IBES data by Refinitiv) which shows the various rates of change for the calendar year estimates for 2020 through 2022:
Here is the forward SP 500 earnings curve:
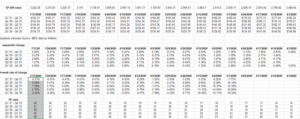
Note the improvement in the 4-week rate of change that started 3 weeks ago.
Looking at Q3 and Q4 ’20 EPS and revenue specifically (no one else is):
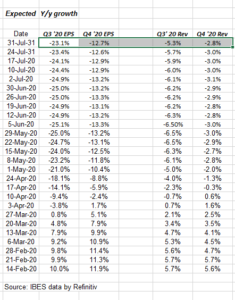
Note the expected revenue growth rate trends for Q3 and Q4 ’20.
Summary / conclusion: Given the weak performance in the overall stock market after the record technology sector earnings on Thursday night, July 30, 2020, the market looks like it is telling investors it is going to consolidate the 2nd quarters gains for a while.
According to the IBES by Refinitiv earnings team, the earnings data above is as of Thursday night, July 30. The revisions that occurred on Friday, July 31 (i.e today) aren’t yet in the numbers and we won’t see until Monday, August 3rd.
Every one wants to be a dranatic bull or bear, making big market calls to garner attention, but we could be looking at the next two months of just “blah” trading and flatter markets as the SP 500 incorporates it’s dramatic rise from March 23rd, 2020 through early June ’20.
The SP 500 earnings trends continue in a favorable direction. I need to lay out some specific sectors just to give readers more detail and insight.
Take everything you read here with great skepticism. It’s one opinion. Markets change quickly and make decisions based on your own risk and financial profile.
Thank for reading.