This weekend’s Weekly Earnings Update which was really the SP 500 forward earnings curve is/was another sign that SP 500 earnings revisions are getting less negative.
There are different ways we can look at the core IBES data (provided by Refinitiv), but looking at the spreadsheet this weekend, other data – historically-listed on this blog in the past supports the same conclusion:
1.) SP 500 EPS revisions still becoming less negative:
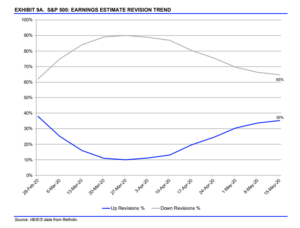
Readers can see how late March – early April ’20 show the nadir for positive revisions (and thus the zenith for negative revisions) and have reversed since.
This chart is the pictorial version of this IBES data tracked and posted for readers every few months:
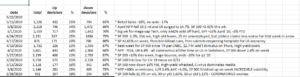
2.) The “forward 4-quarter estimate” for the SP 500 is showing sequential change at lower rate:
In the first row after the actual forward 4-quarter estimate, readers can see where the sequential change started to deteriorate rapidly in mid-March ’20, got a bump when the 1st quarter ended and the new “forward 4-quarter estimate” changed from Q1 – Q4 ’20 to Q2 ’20 through Q1 ’21, and really since around April 10th (just like the graph posted above in #1)
The forward estimate is critical just as the “forward earnings curve” is critical: it gives readers and investors a look beyond the current headlines and remains one of the better leading indicators in print.
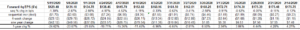
3.) Looking at SP 500 EPS calendar estimates
Same pattern, and like the forward 4-quarter estimate the y/y change in the calendar estimates are still seeing accelerating changes, and my educated guess on this “rate of change” is that when the sequential change starts to flatten or even turn positive, the y/y change will start to flatten as well.
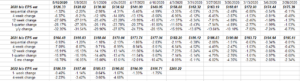
4.) The “average” SP 500 EPS growth rate for 2020 and 2021 remains at 4%
That’s a number that i’ve been tracking since the pandemic started because the shock to the economy of the sheltering-in-place was like throwing your car into “park” while driving on the expressway.
The 2020 – 2021 “average” growth rate for the next two years is 4% and this is the 4th week in a row the 4% metric has shown up.

Here is the core data. You can calculate the average for 2020 and 2021 SP 500 EPS growth if you wish but it will be 4% for the last 4 weeks, after tumbling sharply for the prior 5 – 6 weeks.
Summary / conclusion:
The 2nd quarter, 2020, is expected to be the trough for SP 500 earnings and revenue growth, when both are expected to decline (using this week’s, “This Week in Earnings” data) when SP 500 EPS declines 42% and SP 500 revenue falls 12% y/y, respectively. What’s worrisome is that the 2nd quarter metrics will likely get even worse over the next 6 weeks or until early July ’20 when Q2 ’20 financial results start being reported.
2020 SP 500 earnings will be a complete mess, but this being May 17th already, there is just a little over 7.5 months until the 2021 starts. How far ahead does the SP 500 (the benchmark) discount the SP 500 earnings ? 6 months ? 9 months ? Or 18 months as Wharton b-school professor Dr. Jeremy Siegel noted in an interview with CNBC’s Joe Kernen two weeks ago ?
The current 2021 SP 500 earnings estimate of $164.48 still remains above the actual 2019 SP 500 estimate of $162.39, and given the 24-month duration, I personally think that is an important earnings level to maintain for the benchmark.
No one seems to be talking about the slower rate of erosion in forward SP 500 earnings – and maybe for good reason – since the 20% unemployment rate, the possible 30% drop in Q2 ’20 GDP and the horror show that is the US economic data, seems to have everyone trapped in “Primal Fear”.
2020 could get worse too. Both Q3 and Q4 ’20 quarters are now negative in terms of expected y/y SP 500 EPS growth, but at less negative rates than Q2 ’20.
Prior to the pandemic, this blog’s “traditional” SP 500 earnings metrics, like the SP 500 earnings yield, and the PE ratio, and the PEG ratio (which I’ve concluded is pretty much useless) aren’t practical today given the absolute drop in Q2 ’20 expected earnings.
Tracking the “rate of change” of the forward estimates seems to be a better way to navigate an uncertain environment.
And unless the IBES data is wrong, the forward data rate of change should have some value.
Take everything on this blog with a healthy dose of skepticism. Everything can change tomorrow.
Thanks for reading.