The advantage of the “forward earnings curve” for the SP 500 is that it fills in the interim periods between calendar year EPS, and provides some concrete – albeit constantly changing – earnings data between the calendar years.
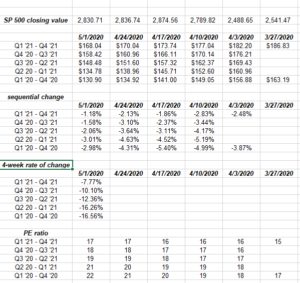
Starting from right to left on the above spreadsheet, the SP 500 EPS dollar estimates between calendar 2020 and calendar 2021, readers can see the change in the dollar estimates as well as the sequential rate of change.
The reason the non-calendar year dollar estimates are missing from the spreadsheet is that IBES data by Refinitiv doesn’t publish bottom-up quarterly estimate data for 2021 until the first week of April of the prior year.
David Aurelio and his team do a good job of publishing the IBES data by Refinitiv on daily and weekly basis.
In yesterday’s blog post here, the emerging “green shoots” are the sequential improvement in this week’s SP 500 EPS dollar estimates in terms of the decelerating rates of decline.
Let’s see if the 4-week rate of change supports the sequential rate of change, next week.
Summary / conclusion: This is truly wonky and geeky stuff, but the data is important to counter the constant stream and litany of opinions heard in the mainstream (lamestream ?) financial media. I listen to the CNBC and Bloomberg (and occasionally Fox) interviews of the same people about the same topics day-in and day-out, week-in and week-out, month-in and month-out (readers get the picture) so the SP 500 earnings data gives me a black-and-white, measured and analytical process – updated every week and weekend – to keep me focused on SP 500 EPS trends both by sector and for the benchmark in general.
It’s clear looking at the bottom-up estimates for the second quarter of 2020, that the Street expect the dollar estimates to bottom in Q2 ’20 and the growth rates are expected to improve from there.
2nd quarter, 2020 earnings results won’t start until July 10th or so, and by that time we’ll see the US economy reopening, probably in fits-and-starts and in an uneven fashion.
In my opinion, the most important data point in the above spreadsheet is the slowing in the rate of the decline in the 2021 SP 500 EPS estimate.
My biggest fear is that the reopening will become increasingly political and angry and SP 500 components are going to be caught in a tug-of-war between healthy practices, political correctness and sound business practices.
Take all of the above with substantial skepticism. All opinions are my own, and the data will change daily and weekly.
Thanks for reading.