One thing that’s been tracked for a while, but might be somewhat useful in this type of market environment where everyone is looking for some “pandemic allegory” is just averaging expected 2020 and 2021 full-year SP 500 growth rates.
Here is what the progression looks like:
- 4/24/20: +4% average expected growth rate of SP 500 earnings for years 2020 and 2021
- 4/17/20: +5%
- 4/10/20: +5%
- 4/3/20: +6%
- 3/31/20: +8%
- 3/27/20: +7%
- 3/20/20: +8%
- 3/13/20: +9%
- 3/6/20: +9%
- 2/29/20: +10%
- 2/21/20: +10%
- 2/14/20: +10%
Source: actual EPS estimate data courtesy of IBES by Refinitiv
The trend is not great. Can’t say I’m encouraged by this.
Tracking “rate of change”:
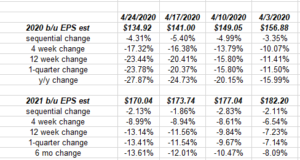
This week’s sequential rate of decline in the bottom-up 2020 SP 500 estimate was the lowest rate of change since early April, which is a small, positive sign.
However I wanted to show readers 2020 and 2021 SP 500 estimates and the rates of change, since I dont think it would good for the SP 500 if 2021’s SP 500 dollar estimate fell below the 2019 “actual” SP 500 EPS of $162.93.
Looking at SP 500 EPS dollar estimates:
Here are the current estimates:
- 2022 – $190.85
- 2021 – $170.04 (est) – currently expecting +26% growth next calendar year
- 2020 – $134.92 (est) – currently expecting a decline in 2020 of 17% y/y
- 2019 – $162.93 (actual) 1 % y/y growth
Summary / conclusion: Navel gazing this earnings data from IBES by Refinitiv can drive you nuts, but during this correction, the question remains given the uncertainty of it all from a vaccine perspective, an economic perspective and an earnings perspective, is when do the forward revisions start to slow at a decelerating rate (or, in other words stabilize), and how much more stress does the SP 500 estimate have to endure ?
I would not want to see the 2021 SP 500 estimate -currently estimated at $170.04 – to fall below 2019’s actual EPS of $162.93.
Reviewing prior bear markets, the year 2000 peak SP 500 actual EPS print of $55.12 wasn’t exceeded until 2003’s $55.44 and only by a very thin margin.
2006’s peak SP 500 actual EPS print of $88.18, wasn’t exceeded until 2011’s $97.82. (2010 was close at $85.12 but fell a little short.)
The 2021 estimate, which will be affected by the November ’20 Presidential election, will hopefully remain above 2019’s actual EPS of $162 per share.
This is all very fluid – take all commentary and “expectation” with substantial skepticism, since it could change daily. The estimates will change daily too.
Rates of change are very important – decelerating declines are very good news. Let’s give the Tech sector and the “Big 5” a chance to report earnings next week.
Thank for reading.